Balance sheet of the agricultural sector, December 31, 2020
Archived Content
Information identified as archived is provided for reference, research or recordkeeping purposes. It is not subject to the Government of Canada Web Standards and has not been altered or updated since it was archived. Please "contact us" to request a format other than those available.
Released: 2021-06-24
$563.2 billion
December 31, 2020
4.4% 
(annual change)
$0.4 billion
December 31, 2020
12.3% 
(annual change)
$2.6 billion
December 31, 2020
2.3% 
(annual change)
$2.5 billion
December 31, 2020
4.3% 
(annual change)
$2.7 billion
December 31, 2020
4.4% 
(annual change)
$58.2 billion
December 31, 2020
4.0% 
(annual change)
$147.0 billion
December 31, 2020
4.4% 
(annual change)
$42.3 billion
December 31, 2020
4.1% 
(annual change)
$110.2 billion
December 31, 2020
3.4% 
(annual change)
$156.6 billion
December 31, 2020
4.4% 
(annual change)
$40.6 billion
December 31, 2020
7.6% 
(annual change)
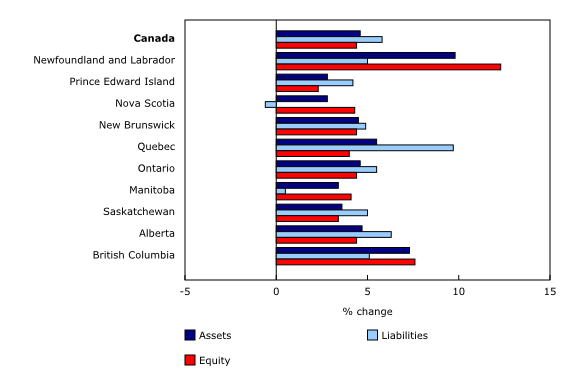
The value of farm equity in Canada rose 4.4% to $563.2 billion as of December 31, 2020, despite total liabilities (+5.8%) rising at a faster pace than total assets (+4.6%) for the third consecutive year.
Equity rose in every province, with Alberta and Ontario (both up 4.4%) accounting for over one half of the national increase.
Total assets increase due to the appreciation of farm real estate
The value of total assets rose $29.9 billion (+4.6%) to $678.9 billion. Farm real estate values, the largest component of farm assets, increased by $25.4 billion (+5.2%). The value of farm real estate assets rose in every province. Significantly higher commodity prices in the latter half of 2020, combined with strong demand for agricultural products and low interest rates all contributed to the increased value of farm real estate.
The value of farm machinery rose 3.8% to $59.3 billion, the largest annual percentage increase since 2016. Values of crop inventories rose 3.1% on higher prices, boosted by strong demand. Moderating the increase in farm assets was the 8.4% decrease in the value of poultry and market livestock inventory to $7.9 billion—its lowest level since 2012. Backlogs at processing facilities related to the COVID-19 pandemic put downward pressure on cattle prices throughout the year.
Liabilities continue to rise
The value of total liabilities increased $6.3 billion (+5.8%) to $115.7 billion, the smallest gain since 2014. Liabilities rose in every province except Nova Scotia (-0.6%). Quebec (+9.7%), Alberta (+6.3%) and Ontario (+5.5%) accounted for four-fifths of the national increase.
Increased leverage in the sector but improved profitability and interest coverage
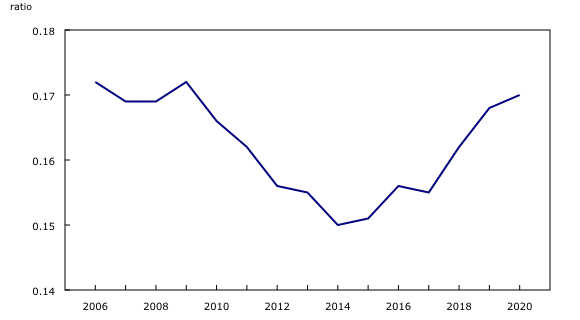
Two debt-related indicators reached their highest levels since 2009. The debt-to-asset ratio reached 0.17 in 2020 while the debt-to-equity ratio increased to 0.21. Both ratios have been trending upwards since 2014. The higher ratios indicate that a growing share of productive agricultural assets are financed by creditors as opposed to farm owners.
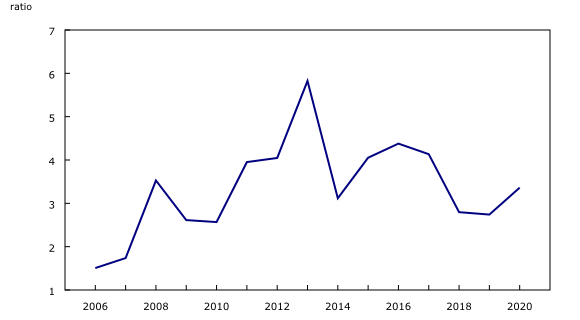
However, strong growth in net income in 2020 pushed the return on assets and return on equity up to near ten-year averages, following recent lows in 2018. Interest coverage, or the ability of a business to pay interest on debt, increased from a recent low of 2.7 in 2019 to 3.4 in 2020, but remained below the previous ten-year average of 3.8.
Note to readers
The balance sheet of the agricultural sector provides the value of farm assets used in agricultural production, the liabilities associated with these assets and the farm sector equity as of December 31 for Canada and the provinces.
Assets and liabilities in the agriculture sector's balance sheet include those of farm businesses and non-operator landlords (for farm real estate assets leased to farm operators and the corresponding liabilities) and exclude the personal portion of farm households. This most closely reflects the assets and liabilities used in agricultural production.
The balance sheet of the agricultural sector integrates data already produced by Statistics Canada, such as farm debt, value of farm capital, livestock and crop estimates, farm product prices, and selected data from the Farm Financial Survey. These data are subject to revision.
Products
Find more agriculture and food statistics.
Support the 2021 Census of Agriculture.
Contact information
For more information, or to enquire about the concepts, methods or data quality of this release, contact us (toll-free 1-800-263-1136; 514-283-8300; STATCAN.infostats-infostats.STATCAN@canada.ca) or Media Relations (613-951-4636; STATCAN.mediahotline-ligneinfomedias.STATCAN@canada.ca).
- Date modified:


