Aircraft movement statistics: Major airports, February 2021
Archived Content
Information identified as archived is provided for reference, research or recordkeeping purposes. It is not subject to the Government of Canada Web Standards and has not been altered or updated since it was archived. Please "contact us" to request a format other than those available.
Released: 2021-04-29
238,964
February 2021
-41.4% 
(year-over-year change)
Highlights
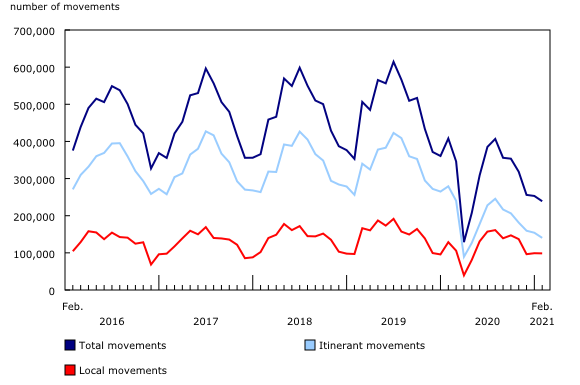
In February, tighter travel restrictions contributed to further reductions in air traffic, with total movements declining 41.4% compared with February 2020. Itinerant movements fell 49.7% and local movements decreased by 23.4%.
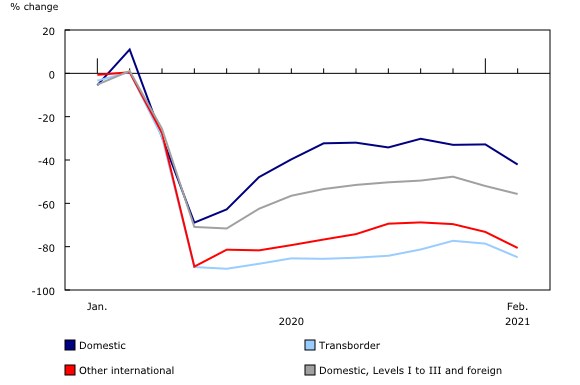
Domestic (within Canada) and other international movements saw their largest year-over-year declines since June 2020, down 42.1% and 80.6%, respectively, from February 2020. Transborder movements (to and from the United States) were down 84.9% year over year.
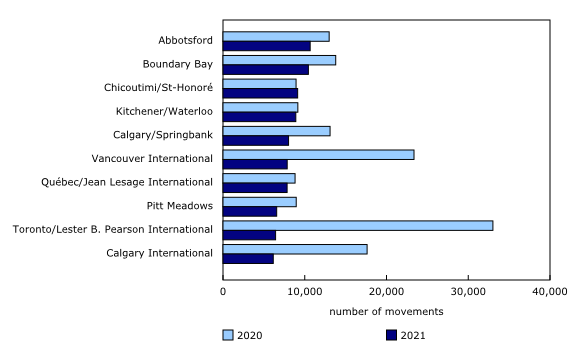
Canada's busiest airport in February was Abbotsford, British Columbia, with 10,660 movements, with local traffic responsible for about two-thirds (66.7%) of the total.
Montréal/Mirabel International in Quebec, one of the country's largest cargo airports, was the only airport to record growth in all types of traffic (domestic, transborder and other international) from February of last year.
Declines go from bad to worse
Air traffic continued to stall in February, with declines going from bad to worse as additional measures to discourage international travel were introduced. From January 31 to April 30, 2021, Canadian air carriers agreed to suspend all passenger flights to Mexico and the Caribbean. Starting February 3, all commercial, private or business, and charter flights arriving from any international destination were directed to funnel through one of four Canadian airports. Effective February 21, passengers who enter Canada have been required to take a COVID-19 test upon arrival and stay in a government-approved hotel for three nights before completing their mandatory 14-day quarantine at home.
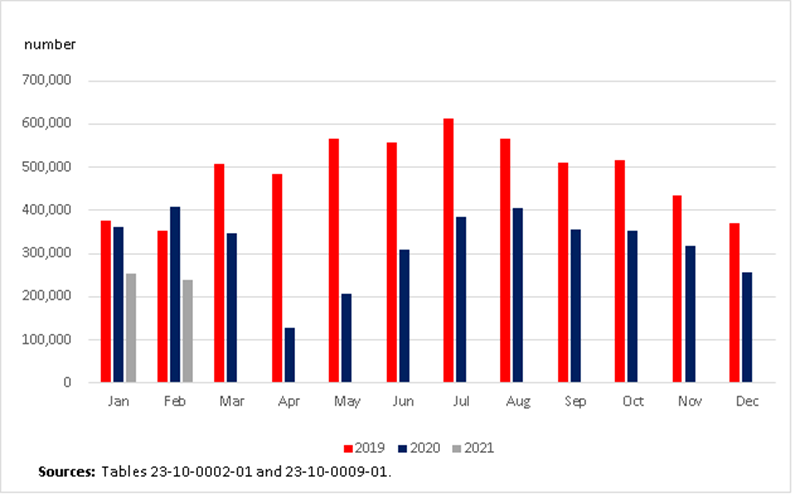
Total aircraft movements (take-offs and landings) at the 90 Canadian airports with NAV CANADA air traffic control towers and flight service stations fell 41.4% compared with February 2020, after a year-over-year decline of 29.8% in January. Itinerant movements were down by one-half (-49.7%) and local movements decreased 23.4%. In February 2020, air traffic in Canada was still relatively unaffected by the COVID-19 pandemic, and Canada's COVID-19-related travel advisories were limited to flights to and from China. Air Canada flights to Beijing and Shanghai were the only suspended routes by a Canadian carrier.
Traffic in all three sectors (domestic, transborder and other international) saw steeper year-over-year declines compared with January. Domestic activity fell 42.1%, the largest year-over-year drop since June 2020. Air traffic to the United States was down 84.9%, and other international movements decreased by 80.6%—also the largest decline since June 2020. Montréal/Mirabel International, Quebec, one of the country's largest cargo airports, was the only airport to record growth in all three sectors from February 2020.
Canada's busiest airports driven by local traffic
Abbotsford, British Columbia, was Canada's busiest airport in February with 10,660 movements; followed by Boundary Bay, British Columbia (10,443 movements); and Chicoutimi/St-Honoré, Quebec (9,134). Local movements, which comprise activities around the airport that are typical of flight training, were responsible for a large proportion of the total movements at all three airports: 66.7% at Abbotsford, 62.5% at Boundary Bay and 76.7% at Chicoutimi/St-Honoré.
Looking ahead
With the heightened travel restrictions announced in late January and rising COVID-19 cases in Canada, air traffic in March should remain well below historical levels. Canada's largest carriers recently announced that they would be extending the three-month suspension of flights to Mexico and the Caribbean until the end of May (Air Canada) and June 4 (WestJet). Although several carriers have announced plans to restart some suspended routes and ramp up service in May and into June, much uncertainty remains amid rising case numbers and variants.
Note to readers
The Aircraft movement statistics: Major airports survey collects data on itinerant and local aircraft movements at major airports in Canada.
Major airports include all airports with either a NAV CANADA air traffic control tower or a NAV CANADA flight service station.
On November 5, 2020, NAV CANADA recognized the increase in air traffic at Red Deer Regional Airport in Alberta before the COVID-19 pandemic and changed its status from a flight service station to offer air traffic control service at the airport for 16 hours per day. As a result, effective November 1, 2020, monthly aircraft movement data for the airport are available in tables 23-10-0002-01 to 23-10-0008-01 (airports with NAV CANADA towers). Data prior to November 2020 remain available in tables 23-10-0009-01 to 23-10-0015-01 (airports with NAV CANADA flight service stations).
An aircraft movement is defined as a take-off, landing or simulated approach by an aircraft, as defined by NAV CANADA.
Data for the same month in the previous year may have been revised.
The data in this monthly release are not seasonally adjusted.
The year 2020 was a leap year; therefore February 2020 had 29 days compared with 28 days in February 2021.
Contact information
For more information, or to enquire about the concepts, methods or data quality of this release, contact us (toll-free 1-800-263-1136; 514-283-8300; STATCAN.infostats-infostats.STATCAN@canada.ca) or Media Relations (613-951-4636; STATCAN.mediahotline-ligneinfomedias.STATCAN@canada.ca).
- Date modified:


