Infographic 1
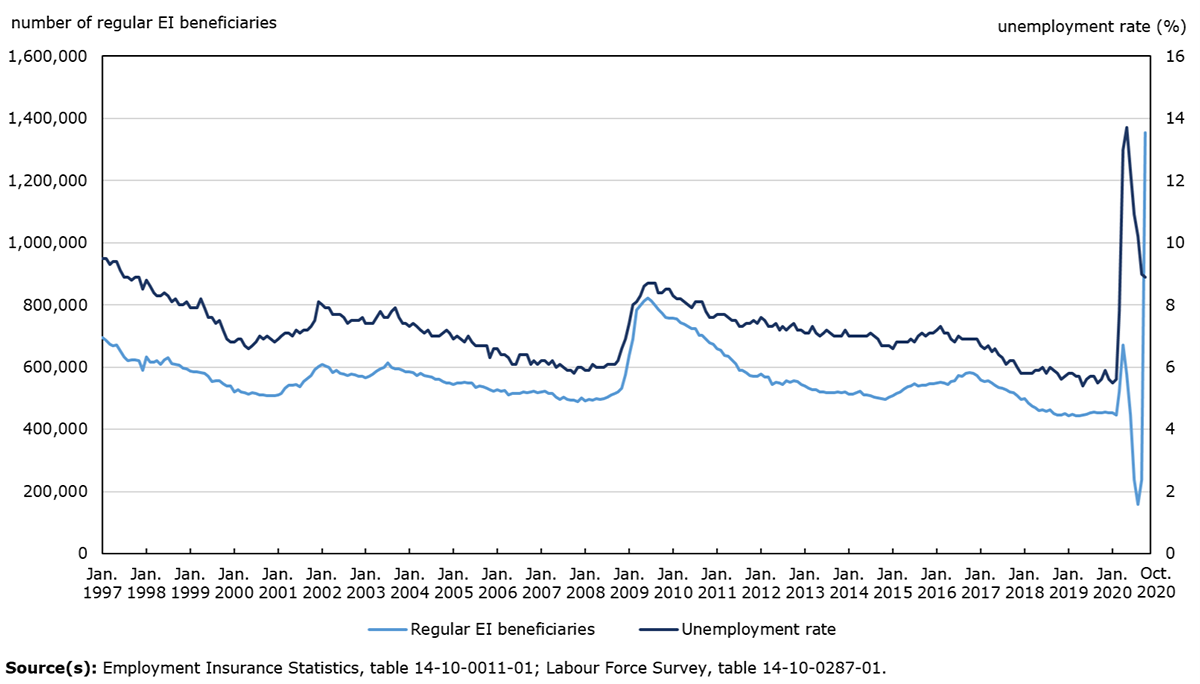
Record number of regular Employment Insurance beneficiaries in October

Infographic description
The title of the infographic is "Record number of regular Employment Insurance beneficiaries in October"
This is a linear chart.
The left vertical axis shows the number of regular EI beneficiaries from 0 to 1,600,000 by increments of 200,000.
The right vertical axis shows the unemployment rate (%) from 0 to 16 by increments of 2.
The horizontal axis shows every month of January, from 1997 to 2020, and also shows October 2020.
The light blue line that represents the number of regular EI beneficiaries shows its lowest point in August 2020 at 159,720 and its highest point in October 2020 at 1,354,240.
The dark blue line that represents the unemployment rate shows its lowest point in May 2019 at 5.4% and its highest point in May 2020 at 13.7%.
Source(s): Employment Insurance Statistics, table 14-10-0011-01; Labour Force Survey, table 14-10-0287-01.
- Date modified: