National balance sheet and financial flow accounts, second quarter 2020
Archived Content
Information identified as archived is provided for reference, research or recordkeeping purposes. It is not subject to the Government of Canada Web Standards and has not been altered or updated since it was archived. Please "contact us" to request a format other than those available.
Released: 2020-09-11
National net worth edges up as Canadian economy adjusts to COVID-19 pandemic restrictions
National net worth, the sum of national wealth and Canada's net foreign asset position, edged up $13.7 billion from the previous quarter to $12,656.7 billion in the second quarter. Overall, upward revaluations in Canada's foreign asset holdings relative to their liabilities outweighed the decline in national wealth. On a per capita basis, national net worth remained relatively stable at $331,531.
Canada's net foreign asset position increased by $160.5 billion to $1,102.2 billion at the end of the second quarter. This increase was largely attributable to the recovery of global stock markets, which had experienced considerable losses at the end of the first quarter. Recent quarterly fluctuations in the net international investment position are strongly linked to the performance of global equity markets. These changing market conditions, driven by shocks such as the COVID-19 pandemic, tend to affect Canada's international assets more than its liabilities, as a higher proportion of assets are held in the form of equities.
National wealth, the value of non-financial assets in the Canadian economy, dropped 1.3% to $11,554.5 billion in the second quarter. The value of natural resources fell 23.9%, as energy prices continued to fall, the fourth consecutive quarter of decline. Inventories decreased in value by $28.7 billion as the corporate sector drew down inventory while faced with supply chain disruptions. The value of residential real estate increased 1.4%, partially offsetting the decline in national wealth as the price of property remained healthy despite limited investment.
Impacts of the COVID-19 pandemic
In the second quarter, the Canadian government continued to institute new measures and expanded existing ones to support the economy while dealing with the effects of the COVID-19 pandemic. Contrary to the first quarter, when assistance became available only in March, many programs were active throughout the second quarter. The necessary funds to support these programs were mainly financed through record sales of government bonds and treasury bills, which fueled a record increase in government borrowing. Despite widespread shutdowns resulting in reduced compensation for households, government transfers and reduced spending pushed household savings to an unprecedented level. This enabled households to shore up their deposit accounts while simultaneously reducing their debt. Meanwhile, non-financial corporations continued to borrow in the second quarter, shifting their source of financing to bond issuances and government aid targeted at businesses. After losing over $2 trillion in value in the first quarter, the value of equity and investment fund assets recovered nearly three quarters of these losses by the end of the second quarter as markets sharply rebounded. Currency and deposits recorded the largest quarterly increase on record as measures to buttress the Canadian economy during the COVID-19 pandemic were in place.
Household savings fuel record amount of net lending
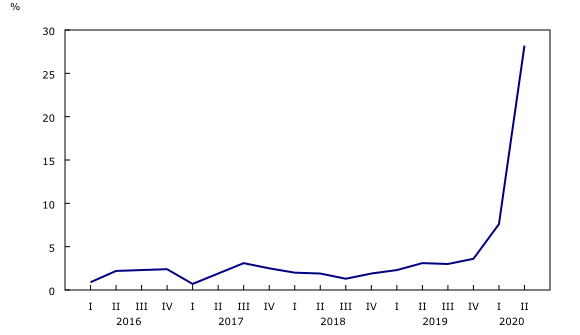
Household sector net lending reached a record $69.0 billion in the quarter. Although compensation of employees dropped considerably, this was more than offset by a significant expansion in government transfers to households meant to blunt the impact of the COVID-19-related measures; the result was a 10.8% increase in household disposable income. This increase, coupled with a 13.7% decline in household spending (in nominal terms), pushed the household saving rate to 28.2% from 7.6% in the previous quarter and 3.6% in the fourth quarter of 2019.
The household savings rate is aggregated across all income brackets; however in general, savings rates are higher for higher income brackets, whereas lower income brackets tend to receive higher levels of government transfers. With a majority of industries experiencing declines in compensation, eligibility for various government COVID-19 programs may have marked a departure from the usual distributions of government support.
As a result of strong net lending, households were able to increase their holdings of financial assets and reduce their non-mortgage and consumer credit debt. On the asset side, additions came primarily in the form of currency and deposits (+$93.9 billion), an unprecedented single quarter increase, as well as $6.5 billion in the purchases of mutual fund shares. On the other side of the ledger, households reduced their non-mortgage debt including consumer credit.
Household sector net worth, the value of all assets less liabilities, increased 5.0% to $11,956.2 billion in the second quarter, a record rebound following the record decline in the first quarter of 2020. The value of financial assets rose $501.0 billion; upward revaluations made up $423.5 billion of this rise, while net acquisitions of financial assets accounted for $77.5 billion. Equity and investment funds were the main contributor to the increase in financial assets, rising $308.1 billion and recovering a sizeable portion of losses from the first quarter. Similarly, the Toronto Stock Exchange increased 16.0% following a 21.6% drop one quarter earlier. Meanwhile, financial liabilities edged up 0.4%.
The value of non-financial assets grew $74.5 billion, largely due to an increase of $78.4 billion in residential real estate. Residential resale sales volumes, reflecting activity in the resale housing market, ground to a crawl in April and May due to restrictions related to the COVID-19 pandemic, down 47.7% in April and May relative to the same period in 2019. Conversely, sales volumes in June 2020 were 16.1% higher than in June 2019, as pent-up demand from the previous months bolstered prices and sales volumes. Reduced activity early in the quarter resulted in a 36.7% decrease in ownership transfer costs, but despite a reduced volume of transactions, the total market value of residential real estate rose 1.4% by the end of the quarter.
Consumer credit drops sharply
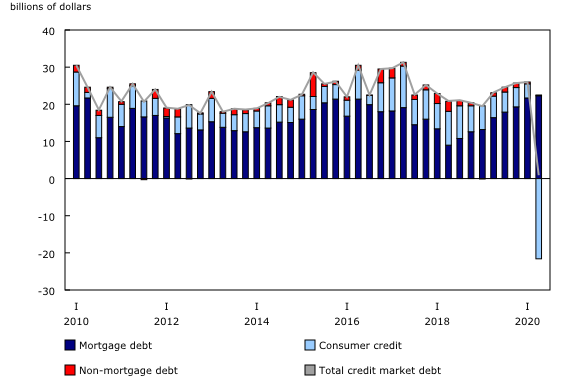
On a seasonally adjusted basis, total credit market borrowing decreased to $0.9 billion in the second quarter from $26.0 billion in the first quarter. The decline was a result of a $21.5 billion decrease in non-mortgage and consumer credit borrowing, as households reduced their principal balance at a much faster pace than they added new debt and household spending dropped 13.7%. Demand for mortgage loans rose to $22.3 billion, up $0.6 billion, as many mortgage providers offered deferred payment options in order to provide relief to borrowers and mortgage rates were low.
The stock of credit market debt (consumer credit, and mortgage and non-mortgage loans) totalled $2,332.5 billion at the end of the quarter. Mortgage debt was $1,553.1 billion, while consumer credit and non-mortgage loans stood at $779.4 billion.
The household debt service ratio, measured as total obligated payments of principal and interest on credit market debt as a proportion of household disposable income, dropped from 14.54% to 12.40%, the largest decline on record. Payment deferrals related to the COVID-19 pandemic reduced the obligated principal paid in the second quarter.
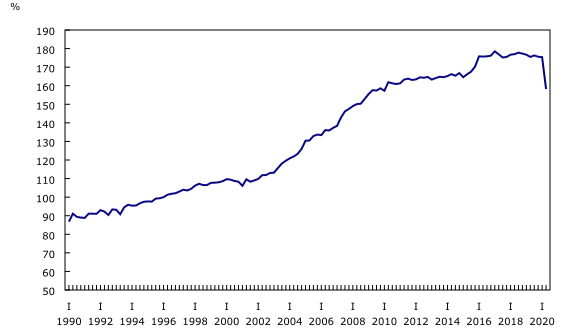
Household credit market debt as a proportion of household disposable income fell from 175.4% to 158.2%, as household disposable income increased 10.8% and the stock of credit market debt remained relatively unchanged. In other words, there was $1.58 in credit market debt for every dollar of household disposable income. The credit market debt to disposable income ratio is aggregated across all income brackets; however, annual trends show that households in lower income quintiles tend to have a higher debt to disposable income ratio. According to the Distributions of Household Economic Accounts, in 2019, households in the lowest income quintile had a credit market debt to disposable income ratio of 281.7%, while the highest income quintile was 139.8%. Government transfers to households in 2019 were 62.6% higher for households in the lowest income quintile than those in the highest income quintile. To alleviate the economic impact of the COVID-19 pandemic, transfers from government to households were mostly distributed to individuals whose income levels dropped or who are part of an economically vulnerable population, so the impact on credit market debt may diverge from historical distributions.
Government borrowing hits new record in response to COVID-19 pandemic
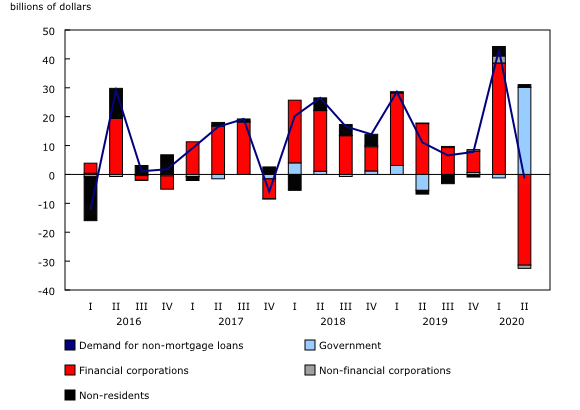
Decreased revenues and increased program expenditures resulted in a record level of government net borrowing. The federal government demand for credit market debt was $302.0 billion in the second quarter, primarily in the form of net issuances of short term paper (+$234.4 billion) and federal bonds (+$65.7 billion), the largest net issuances on record for each of these instruments. Other levels of government (excluding social security funds) also increased their borrowing in the second quarter, to $62.0 billion, mainly in the form of provincial bond issuances.
The central bank accounted for a significant portion of the purchases of government-backed securities in an effort to support the economy and provide funding to the government. Additionally, several government programs were initiated to support businesses through direct lending, with government non-mortgage loan assets rising $30.3 billion in the second quarter.
The ratio of federal government net debt (book value of total financial liabilities less total financial assets) to gross domestic product (GDP) jumped to 32.0%, the largest quarterly increase in the life of the time series, as federal government net borrowing increased and GDP contracted sharply during the quarter. The ratio of other government net debt (excluding social security funds) to GDP increased from 27.6% to 28.6%.
Non-financial private corporations shift sources of financing
The demand for funds by non-financial private corporations was $38.0 billion, down from $44.5 billion in the previous quarter. In the first quarter, non-financial private corporations relied heavily on non-mortgage loans, provided primarily by chartered banks and non-residents, as interim financing for their operational needs. During the second quarter, borrowing shifted to longer-term debt largely through bond issuances. Borrowing in the form of non-mortgage loans was down in the quarter, reflecting decreased loans with chartered banks and a nearly offsetting increase in borrowing from the federal government related to programs, such as the Canadian Emergency Business Account.
The debt-to-equity ratio (market value) of non-financial private corporations fell from 213.2% to 199.7%. Equity of non-financial private corporations increased more than their debt, as stock prices rebounded sharply.
The ratio of non-financial private corporations' credit market debt (book value) to GDP increased from 70.5% to 73.3%, as GDP fell sharply during the quarter and their debt levels rose.
Financial sector lending skyrockets
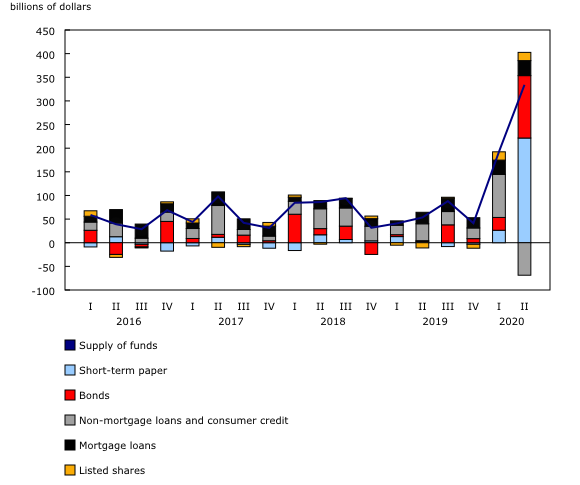
The financial sector provided $334.0 billion in funds to the economy through financial market instruments, up from $192.3 billion in the previous quarter. Second quarter financing was mainly in the form of short-term paper (+$221.5 billion) and bonds (+$132.0 billion), the highest levels on record. This increase in lending was dampened by a $54.0 billion reduction of financing in the form of non-mortgage loans.
The market value of financial assets was up 8.0% to $16,898.9 billion. Holdings of equity and investment fund shares (+$754.9 billion) increased in the quarter, as markets recovered a significant portion of losses. Mutual funds and trusteed pension plans, two sectors whose wealth is ultimately held by households, experienced growth in the value of their assets primarily due to upward revaluations in their holdings of foreign equity, mutual fund shares, and listed shares. Increased holdings of debt securities (+$415.3 billion) boosted lending in the second quarter as the central bank accelerated purchases of government securities. Currency and deposit assets, mainly held by chartered banks, grew $212.1 billion in the quarter while loan assets fell $55.2 billion.
Note to readers
Revisions to first quarter estimates
When first-quarter data were released on June 12, Statistics Canada's data collection and compilation were hampered by the sudden imposition of work restrictions and technical and operational constraints. Subsequently, Statistics Canada was able to overcome those limitations and produce revised first-quarter data, which are included with this release. Data from the Quarterly Survey of Financial Statements, which provides financial data for corporations, were unavailable at the time of first quarter national balance sheet and financial flow accounts estimation; consequently, data were based on in-progress estimates rather than the final results. This release applied the final results for both quarters.
Specific conceptual treatments and adjustments
To alleviate the economic impact of the COVID-19 pandemic, governments have implemented a number of programs, including Canada Emergency Wage Subsidy and Canada Emergency Response Benefit. For a comprehensive explanation of how government support measures were treated in compilation of the estimates, see the report "Recording COVID-19 measures in the national accounts."
Corporate and government sectors have offered payment deferrals in a variety of forms. In government accounts, the deferred revenue will be booked as it normally would be and an accounts receivable item will be recorded. The cash position of the sector receiving the deferrals will increase for the duration of the deferrals, while that of the governments concerned will decrease, compared to the case with no such deferrals.
The Bank of Canada has introduced a number of initiatives designed to support the Canadian economy. For example, it announced the establishment of the Commercial Paper Purchase Program, aimed to alleviate strains in short-term finance markets. The effects of these initiatives, among others, will be seen in the Financial and Wealth Accounts.
Revisions
This second quarter release of the national balance sheet and financial flow accounts includes revised estimates from the first quarter of 2020. These data incorporate new and revised data, as well as updated data on seasonal trends. Additionally, as of the release for the third quarter of 2019, new financial subsector detail is available. The subsector "Other private financial institutions" was broken down into additional financial subsectors and specific financial sectors have been re-grouped. This will help align more closely with current international classifications. An overview of these changes to the sector classification and information on other conceptual, methodological, and statistics revisions is available in "An overview of revisions to the Financial and Wealth Accounts, 1990 to 2019" (13-605-X).
In the near future, data enhancements to the national balance sheet and financial flow accounts, such as the development of detailed counterparty information by sector, will be incorporated. To facilitate this initiative and others, it is necessary to extend the annual revision period (normally the previous three years) at the time of the third quarter release. Consequently, for the next two years, with the third quarter release of the financial and wealth accounts, data will be revised back to 1990 to ensure a continuous time series.
Financial and wealth accounts on a from-whom-to-whom basis: Selected financial instruments
The data visualization product "Financial accounts on a from-whom-to-whom basis, selected financial instruments" has been updated with data from the first quarter of 2020 to the second quarter of 2020.
Next release
Data on the national balance sheet and financial flow accounts for the third quarter will be released on December 11.
Overview of the Financial and Wealth Accounts
This release of the Financial and Wealth Accounts comprises the National Balance Sheet Accounts (NBSA), the Financial Flow Accounts (FFA), and the other changes in assets account.
The NBSA are composed of the balance sheets of all sectors and subsectors of the economy. The main sectors are households, non-profit institutions serving households, financial corporations, non-financial corporations, government and non-residents. The NBSA cover all national non-financial assets and all financial asset-liability claims outstanding in all sectors. To improve the interpretability of financial flows data, selected household borrowing series are available on a seasonally adjusted basis (table 38-10-0238-01). All other data are unadjusted for seasonal variation. For information on seasonal adjustment, see Seasonally adjusted data – Frequently asked questions.
The FFA articulate net lending or borrowing activity by sector by measuring financial transactions in the economy. The FFA arrive at a measure of net financial investment, which is the difference between transactions in financial assets and liabilities (for example, net purchases of securities less net issuances of securities). The FFA also provide the link between financial and non-financial activity in the economy, which ties estimates of saving and non-financial capital acquisition (for example, investment in new housing) to the underlying financial transactions.
While the FFA record changes in financial assets and liabilities between opening and closing balance sheets that are associated with transactions during the accounting period, the value of assets and liabilities held by an institution can also change for other reasons. These other types of changes, referred to as other economic flows, are recorded in the other changes in assets account.
There are two main components to this account. One is the other changes in the volume of assets account. This account includes changes in non-financial and financial assets and liabilities relating to the economic appearance and disappearance of assets, the effects of external events such as wars or catastrophes on the value of assets, and changes in the classification and structure of assets. The other main component is the revaluation account, showing holding gains or losses accruing to the owners of non-financial and financial assets and liabilities during the accounting period as a result of changes in market price valuations.
At present, only the aggregate other change in assets is available within the Canadian System of Macroeconomic Accounts; no details are available on the different components.
Definitions concerning financial indicators can be found in Financial indicators from the National Balance Sheet Accounts and in the Canadian System of Macroeconomic Accounts glossary.
More information on the Distributions of Household Economic Accounts is available in table 36-10-0587-01.
Products
The data visualization product "Financial accounts on a from-whom-to-whom basis, selected financial instruments," part of Statistics Canada—Data Visualization Products (71-607-X), is now available.
The Economic accounts statistics portal, accessible from the Subjects module of our website, features an up-to-date portrait of national and provincial economies and their structure.
The Latest Developments in the Canadian Economic Accounts (13-605-X) is available.
The User Guide: Canadian System of Macroeconomic Accounts (13-606-G) is available.
The Methodological Guide: Canadian System of Macroeconomic Accounts (13-607-X) is available.
Contact information
For more information, or to enquire about the concepts, methods or data quality of this release, contact us (toll-free 1-800-263-1136; 514-283-8300; STATCAN.infostats-infostats.STATCAN@canada.ca) or Media Relations (613-951-4636; STATCAN.mediahotline-ligneinfomedias.STATCAN@canada.ca).
- Date modified:


