Infographic 1
Disruptions to the Canadian airline industry

Infographic description
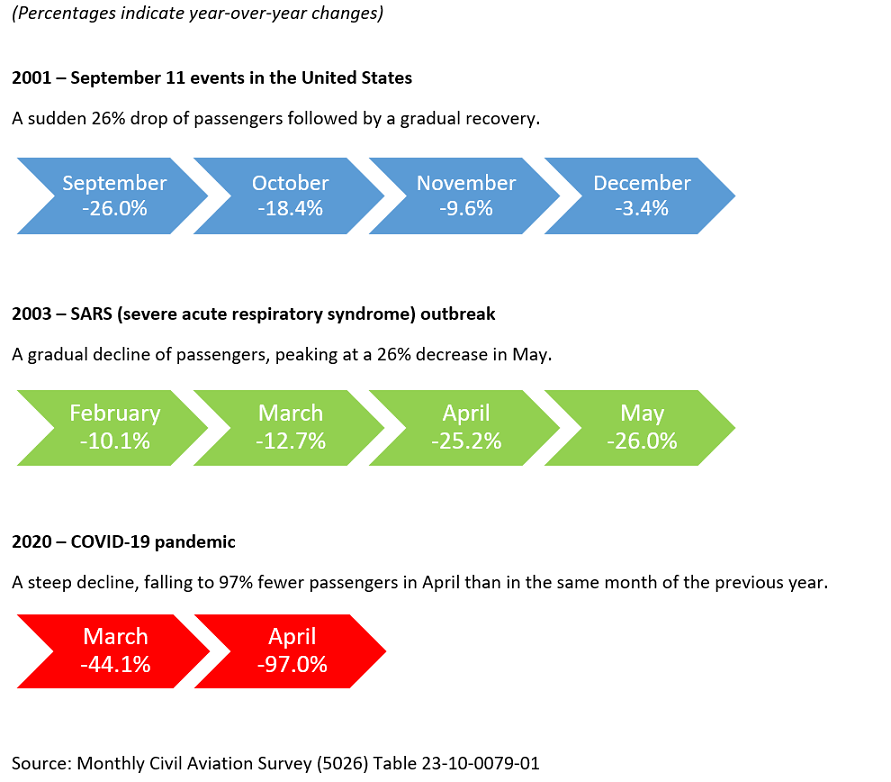
The title of the infographic is "Disruptions to the Canadian airline industry"
In brackets underneath the title it says "Percentages indicate year over year changes".
The first subheading is "2001 – September 11 events in the United States". The description under this subheading says "A sudden 26% drop of passengers followed by a gradual recovery."
There are four blue arrows in a row pointing to the right. Each arrow contains one month with the year over year percentage change for that month. The first arrow is for the month of September, and the change is minus 26.0%. The second arrow is for the month of October, and the change is minus 18.4%. The third arrow is for the month of November, and the change is minus 9.6%.The fourth arrow is for the month of December, and the change is minus 3.4%.
The second subheading is "2003 – SARS (severe acute respiratory syndrome) outbreak". The description under this subheading says "A gradual decline of passengers reaching a 26% decrease in May."
There are four green arrows in a row pointing to the right. Each arrow contains one month with the year over year percentage change for that month. The first arrow is for the month of February, and the change is minus 10.1%. The second arrow is for the month of March, and the change is minus 12.7%. The third arrow is for the month of April, and the change is minus 25.2%.The fourth arrow is for the month of May, and the change is minus 26.0%.
The third subheading is "2020 – COVID-19 pandemic". The description under the subheading says "A steep decline, falling to 97% fewer passengers than the previous year."
There are two red arrows in a row pointing to the right. Each arrow contains one month with the year over year percentage change for that month. The first arrow is for the month of March, and the change is minus 44.1%. The second arrow is for the month of April, and the change is minus 97.0%.
Source(s): Monthly Civil Aviation Survey (5026); Table 23-10-0079-01.
- Date modified: