Natural resource indicators, third quarter 2018
Archived Content
Information identified as archived is provided for reference, research or recordkeeping purposes. It is not subject to the Government of Canada Web Standards and has not been altered or updated since it was archived. Please "contact us" to request a format other than those available.
Released: 2019-01-17
Volume of natural resource gross domestic product increases
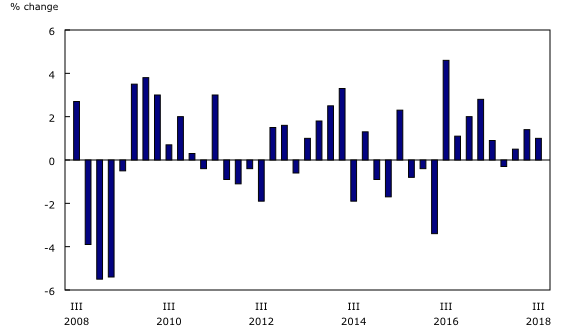
Real gross domestic product (GDP) of the natural resource sector, or the volume of economic activity attributable to natural resources, rose 1.0% in the third quarter, following a 1.4% increase in the second quarter. By comparison, real GDP for the total economy grew 0.5% in the third quarter.
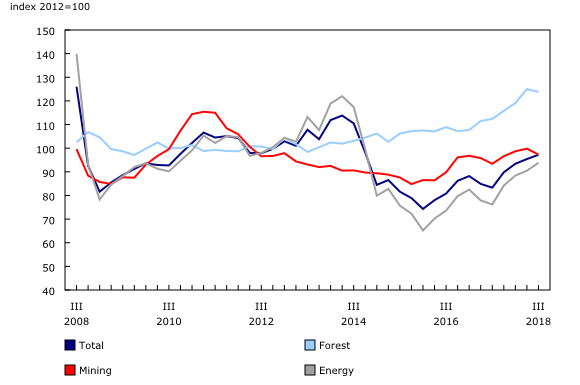
Real GDP in the mineral and mining subsector rose 4.1% in the third quarter following a 3.6% decline in the second quarter. The primary contributors to this increase were non-metallic minerals (+9.9%), which grew on the strength of potash, as well as metallic minerals (+7.6%). The increase in metallic minerals coincided with the end of work stoppages at the Carol Lake iron ore mine in Newfoundland and Labrador, which disrupted production throughout most of the second quarter.
Real GDP in the energy subsector grew 0.3%, on large gains in GDP for refined petroleum products (+22.8%). Several refineries resumed production after a number of shutdowns in the previous quarter. The increase in refined petroleum products was partly offset by declines in crude oil extraction (-1.2%) and energy-related services (-2.5%).
Real GDP in the hunting, fishing and water subsector rose 1.3%, while the forestry subsector edged down 0.4%.
Natural resource activity totalled $252.3 billion (nominal terms, at annual rates) in the third quarter, accounting for 12.1% of Canada's GDP, up from 11.9% in the second quarter.
Natural resource prices increase
Natural resource prices rose 1.9% in the third quarter, with increases in the energy and hunting, fishing and water subsectors offsetting decreases in the mineral and mining and forestry subsectors. The growth in prices in the energy subsector (+3.6%) was widespread, with crude oil (+4.0%) and total refined petroleum product (+1.7%) prices rising from July to September.
Early fourth quarter estimates point to a reversal in this upward trend, as a global surplus in the supply of crude oil has begun to negatively pressure prices. The Raw Materials Price Index, a key input into the natural resource indicators, reported a 20.9% year-over-year decrease in crude energy products in November.
Declines in the forestry subsector (-0.9%) were mainly attributable to sawmill and wood products (-2.8%), following substantial increases over the past year due to strong housing demand in the United States, coupled with American tariffs on softwood lumber. Despite this drop, prices for sawmill and wood products remained above historic levels. Declines in mineral and mining prices (-2.5%) were concentrated in metallic mineral extraction (-5.4%) and primary metallic mineral products (-4.0%).
Exports of natural resources increase as imports fall
Real natural resource exports grew 2.8% in the third quarter, following a 5.3% increase in the second quarter. Exports in the mineral and mining subsector were up 4.9%, with exports of metallic metals (+37.8%) up sharply as iron ore production resumed after recent work stoppages. Energy product exports (+2.8%) also rose on higher exports of total refined petroleum products (+14.1%).
Real exports in the forestry subsector fell 2.8%, with exports of primary pulp and paper products declining 4.3%.
Real natural resource imports (-8.9%) fell sharply in the third quarter. Imports in the energy subsector decreased 13.4%, led by total refined petroleum products (-26.5%), as domestic production increased with the reopening of a number of refineries following shutdowns in the second quarter.
The number of jobs edges up
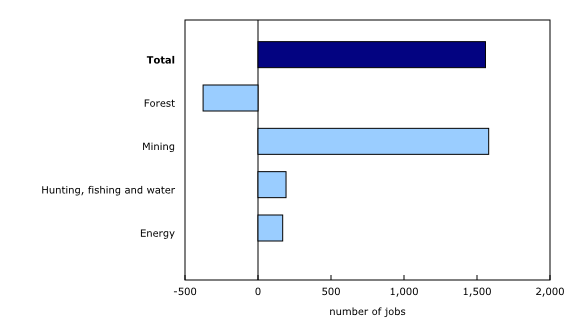
The number of jobs in the natural resource sector edged up 0.3% in the third quarter, after increasing 0.5% in the second quarter. The mineral and mining subsector added approximately 1,600 jobs (+0.8%), the largest increase of any subsector. The number of jobs in the forestry subsector fell by approximately 400 (-0.3%).
Downstream activities increase
Secondary and tertiary processing for the forestry and minerals and mining subsectors are identified separately in the natural resource indicators for analytical purposes. An additional 1.7% of Canadian GDP is attributable to these downstream activities.
Real GDP of these additional downstream activities decreased 1.2% in the third quarter. Downstream forestry activities declined 2.7%, while downstream mineral and mining activity fell 0.6%.
Note to readers
The natural resource indicators (NRI) provide quarterly indicators for the main aggregates in the Natural Resource Satellite Account (NRSA), namely, nominal and real gross domestic product as basic prices, output, real exports and imports and employment. The estimates from this account are directly comparable to the estimates found in the Canadian System of Macroeconomic Accounts.
The energy subsector accounts for approximately two-thirds of the Canadian natural resource sector, while the mining subsector accounts for just over 20%. The forest (8%) and hunting, fishing and water (4%) subsectors account for the rest.
Core natural resources: The NRSA defines natural resource activities as those which result in goods and services originating from naturally-occurring assets used in economic activity, as well as their initial processing (primary manufacturing).
Downstream activities: Although not part of the core account, natural resources have important downstream effects on other sectors. In general, this production uses a large portion of primary manufactured products as inputs.
With the third quarter of 2018 release of the NRI and the 2017 release of the NRSA, constant dollar estimates of gross domestic product and international trade have been rebased from 2007=100 to 2012=100 in line with the other macroeconomic accounts.
Note: Natural resource bioproducts have been added to the NRSA as of the release of NRI for the first quarter of 2018. For the purpose of the account, bioproducts are split into four categories:
Energy and forestry subsectors:
- Energy subsector: Bioenergy
- Energy subsector: Biofuels
- Forestry subsector: Bioenergy and biofuels from forestry biomass (a subset of 1) and 2));
- Forestry subsector: Other bioproducts from forestry biomass.
Total of natural resource bioproducts = bioenergy (1) + biofuels (2) + other bioproducts from forestry biomass (4)
Next release
Data on natural resource indicators for the fourth quarter of 2018 will be released on March 26, 2019.
Products
Additional information can be found in the articles "The Natural Resources Satellite Account: Feasibility study" and "The Natural Resources Satellite Account – Sources and methods," which are part of the Income and Expenditure Accounts Technical Series (13-604-M).
The Latest Developments in the Canadian Economic Accounts (13-605-X) is available.
The User Guide: Canadian System of Macroeconomic Accounts (13-606-G) is available.
The Methodological Guide: Canadian System of Macroeconomic Accounts (13-607-X) is available.
Contact information
For more information, or to enquire about the concepts, methods or data quality of this release, contact us (toll-free 1-800-263-1136; 514-283-8300; STATCAN.infostats-infostats.STATCAN@canada.ca) or Media Relations (613-951-4636; STATCAN.mediahotline-ligneinfomedias.STATCAN@canada.ca).
- Date modified:


