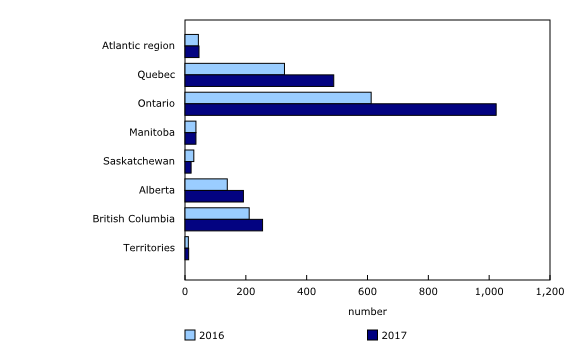
Chart 2
Police-reported hate crimes, by region, 2016 and 2017

Note(s):
Information in this chart reflects data reported by police services covering 99.6% of the population of Canada.
Source(s):
Canadian Centre for Justice Statistics, Uniform Crime Reporting Survey (3302).
Chart description
This is a bar clustered chart.
| 2016 | 2017 | |
|---|---|---|
| Atlantic region | 44 | 46 |
| Quebec | 327 | 489 |
| Ontario | 612 | 1,023 |
| Manitoba | 36 | 36 |
| Saskatchewan | 29 | 20 |
| Alberta | 139 | 192 |
| British Columbia | 211 | 255 |
| Territories | 11 | 12 |
Note(s):
Information in this chart reflects data reported by police services covering 99.6% of the population of Canada.
Source(s):
Canadian Centre for Justice Statistics, Uniform Crime Reporting Survey (3302).
- Date modified: