Chart 2
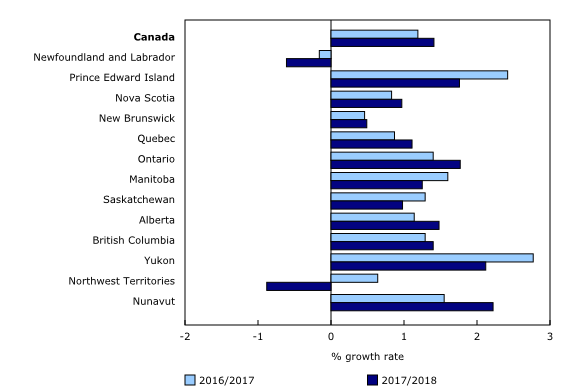
Population growth rate, 2016/2017 and 2017/2018, Canada, provinces and territories

Note(s):
The population growth rate for each annual period corresponds to the population growth rate from July 1 to June 30. For example, the population growth rate for 2017/2018 corresponds to the population growth rate from July 1, 2017, to June 30, 2018.
Source(s):
Table 17-10-0009-01 (formerly CANSIM table 051-0005).
Chart description
This is a bar clustered chart.
| 2016/2017 | 2017/2018 | |
|---|---|---|
| Canada | 1.19 | 1.41 |
| Newfoundland and Labrador | -0.16 | -0.61 |
| Prince Edward Island | 2.42 | 1.76 |
| Nova Scotia | 0.83 | 0.97 |
| New Brunswick | 0.46 | 0.49 |
| Quebec | 0.87 | 1.11 |
| Ontario | 1.40 | 1.77 |
| Manitoba | 1.60 | 1.25 |
| Saskatchewan | 1.29 | 0.98 |
| Alberta | 1.14 | 1.48 |
| British Columbia | 1.29 | 1.40 |
| Yukon | 2.77 | 2.12 |
| Northwest Territories | 0.64 | -0.88 |
| Nunavut | 1.55 | 2.22 |
Note(s):
The population growth rate for each annual period corresponds to the population growth rate from July 1 to June 30. For example, the population growth rate for 2017/2018 corresponds to the population growth rate from July 1, 2017, to June 30, 2018.
Source(s):
Table 17-10-0009-01 (formerly CANSIM table 051-0005).
- Date modified: