Building construction price indexes, second quarter 2018
Archived Content
Information identified as archived is provided for reference, research or recordkeeping purposes. It is not subject to the Government of Canada Web Standards and has not been altered or updated since it was archived. Please "contact us" to request a format other than those available.
Released: 2018-08-16
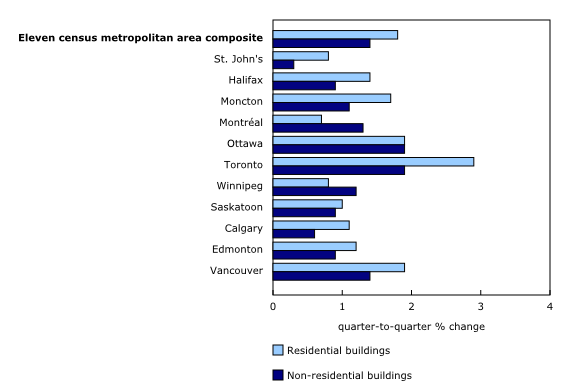
Construction prices for new residential buildings rose more than those for new non-residential buildings in the second quarter. According to the contractors surveyed, increases in new building construction costs were driven by higher lumber and steel prices, both of which have been affected by the tariffs imposed in the last few months.
Residential buildings, quarterly change
Contractor prices for new residential building construction rose 1.8% in the second quarter, following an identical increase in the first quarter. The increase in the second quarter was mainly due to higher construction costs for single-detached houses (+2.0%), on the strength of higher lumber prices. Prices for softwood lumber (except tongue and groove and other edge worked lumber), as measured by the Industrial Product Price Index (IPPI), rose 20.5% from January to June.
Construction prices were up for all new residential building types across the 11 surveyed census metropolitan areas (CMAs). The largest increases were reported in Toronto (+2.9%), and in Ottawa and Vancouver (+1.9% for each). In Toronto, the largest increases in construction costs were for single-detached houses and low-rise apartment buildings (+2.9% for each).
Residential buildings, 12-month change
Prices charged by contractors for new residential building construction were up 7.5% over the 12-month period ending in the second quarter, compared with the same period in 2017. Prices rose the most in Winnipeg (+11.7%) and Toronto (+10.0%).
Non-residential buildings, quarterly change
In the second quarter, prices for new non-residential building construction increased 1.4% in all CMAs included in the survey. Prices rose the most in Ottawa and Toronto (+1.9% for each).
Construction prices for industrial buildings, especially factories (+1.7%), posted the largest increase during this period. The strongest gain was for the construction of factory buildings in Ottawa (+2.5%). This increase was mainly due to the rising cost of steel products, which are important components in factory construction. From January to June, prices for basic and semi-finished iron and steel products, as measured by the IPPI, rose 10.8%.
Non-residential buildings, 12-month change
Prices charged by contractors for new non-residential building construction were up 3.3% over the 12-month period ending in the second quarter, mostly due to higher prices in Vancouver (+4.8%).
Note to readers
The building construction price indexes (BCPI) are quarterly series that measure change over time in the prices that contractors charge to construct a range of new commercial, institutional, industrial and residential buildings in 11 census metropolitan areas: St. John's, Halifax, Moncton, Montréal, Ottawa–Gatineau (Ontario part), Toronto, Winnipeg, Saskatoon, Calgary, Edmonton and Vancouver.
These buildings include six non-residential structures: an office building; a warehouse; a shopping centre; a factory; a school; and a bus depot with maintenance and repair facilities. In addition, indexes are produced for five residential structures, including a bungalow, a two storey house, a townhouse, a high rise apartment building (five storeys or more) and a low rise apartment building (less than five storeys).
The contractor's price reflects the value of all materials, labour, equipment, overhead and profit to construct a new building. It excludes value added taxes and any costs for land, land assembly, building design, land development and real estate fees.
With each release, data for the previous quarter may have been revised. The index is not seasonally adjusted.
A Historical Timeline of Canadian Producer Price Statistics
"A Historical Timeline of Canadian Producer Price Statistics," which is part of the Prices Analytical Series (62F0014M), was created to showcase the key milestones in the history of Canadian producer price statistics. This historical timeline contains answers to questions such as: Who collected Canada's first statistics? What do Canadian producer price indexes measure?
Infographic: Producer Price Indexes at a Glance
The infographic "Producer Price Indexes at a Glance," which is part of Statistics Canada — Infographics (11-627-M) demonstrates how producer price indexes for goods and services are calculated and why they are important for the Canadian economy.
Contact information
For more information, or to enquire about the concepts, methods or data quality of this release, contact us (toll-free 1-800-263-1136; 514-283-8300; STATCAN.infostats-infostats.STATCAN@canada.ca) or Media Relations (613-951-4636; STATCAN.mediahotline-ligneinfomedias.STATCAN@canada.ca).
- Date modified:


