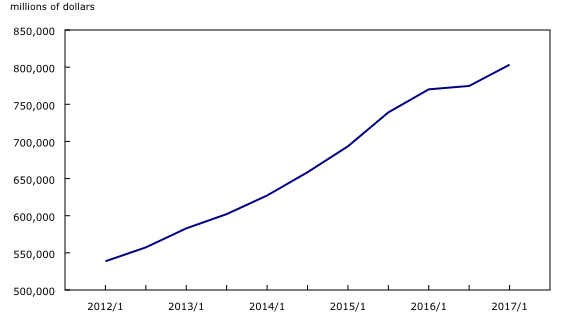
Chart 1
Total credit outstanding

Source(s):
CANSIM table 190-0001.
Chart description
This is a line chart.
| millions of dollars | |
|---|---|
| 2012/1 | 538,661 |
| 2012/2 | 557,389 |
| 2013/1 | 582,967 |
| 2013/2 | 602,155 |
| 2014/1 | 627,201 |
| 2014/2 | 658,508 |
| 2015/1 | 693,410 |
| 2015/2 | 739,066 |
| 2016/1 | 770,101 |
| 2016/2 | 774,703 |
| 2017/1 | 803,287 |
Source(s):
CANSIM table 190-0001.
- Date modified: