Oil and gas extraction, 2016
Archived Content
Information identified as archived is provided for reference, research or recordkeeping purposes. It is not subject to the Government of Canada Web Standards and has not been altered or updated since it was archived. Please "contact us" to request a format other than those available.
Released: 2017-10-06
The Canadian oil and gas extraction industry continued its downward trend in 2016.
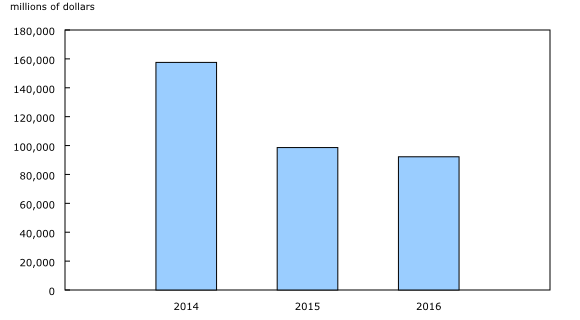
Total revenue decreased 6.5% to $92.2 billion in 2016, following a 37.4% decline in 2015. Total expenses and deductions decreased 21.1% to $118.0 billion in 2016, resulting in a net loss of $25.7 billion, compared with a net loss of $50.9 billion in 2015.
The oil and gas extraction industry continued to decrease as industrial prices remained down. In 2016, the average annual price of crude oil and crude bitumen declined 8.0% year over year, according to the Raw Materials Price Index, while the average annual price of natural gas decreased 12.0%.
Capital and operating expenditures decline
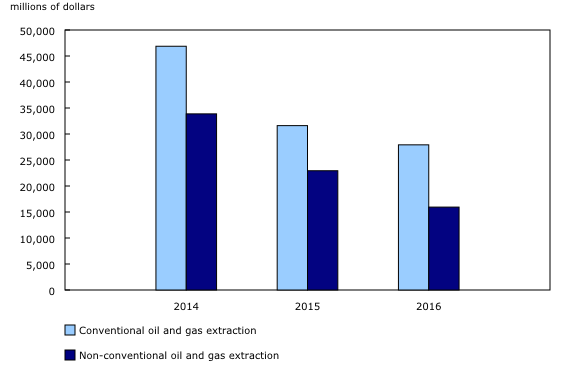
Capital expenditures in the oil and gas extraction industry decreased 19.6% to $43.9 billion in 2016. The decline was mainly attributed to the non-conventional sector, where capital spending fell 30.5% to $15.9 billion. Capital expenditures in the conventional oil and gas extraction sector declined 11.7% to $27.9 billion.
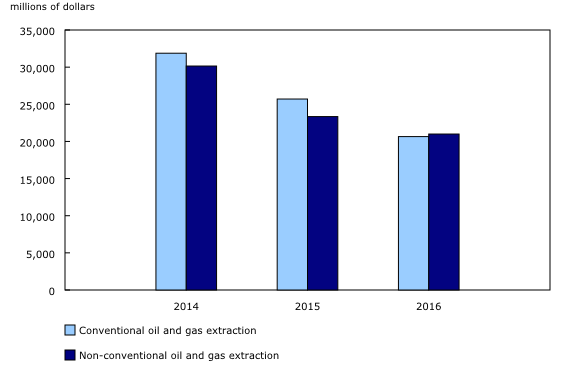
Total operating expenditures (operating cost and royalties) were down 15.1% from 2015 to $41.7 billion in 2016. Total operating expenditures in the non-conventional oil and gas extraction sector were down 10.1% to $21.0 billion, while the conventional oil and gas extraction sector reduced operating expenditures by 19.7% to $20.7 billion. Royalty payments, in particular, fell 29.1% to $3.7 billion in 2016.
The volume of marketable production rises, while the value falls
Production volumes for both crude oil and equivalent products as well as natural gas continued to increase in 2016. However, the overall value of these products decreased 9.0% to $81.3 billion.
Production of crude oil and equivalent products rose 0.2% to 214.0 million cubic metres in 2016—the seventh consecutive annual increase. Meanwhile, the market value of these products fell 9.7% from 2015 to $61.8 billion.
Although marketable production of natural gas increased 7.2% to 159.8 billion cubic metres, the value decreased 11.6% to $12.3 billion. Over the same period, production of natural gas by-products rose by 11.8% to 46.1 million cubic metres in 2016, and the value increased 3.2% to $7.2 billion.
Total assets decrease
Canadian oil and gas extraction companies reported $548.8 billion in total assets in 2016, down 4.0% compared with 2015. The decline was mainly attributable to net capital assets, which were down 4.9% to $428.7 billion.
Over the same period, long-term debt fell 26.4% to $110.6 billion, while equity was up 7.6% to $265.7 billion.

In celebration of the country's 150th birthday, Statistics Canada is presenting snapshots from our rich statistical history.
Crude oil and natural gas have been a part of Canada's energy system for over 150 years. Early exploration results were sometimes more by luck as crude petroleum was often found on land surfaces and did not require the drilling and exploration methods that are applied today.
The first crude oil production was established in 1857 at Oil Springs, Ontario. In 1867, the year of Canada's Confederation, Canada produced over 30,000 cubic metres of crude oil according to the Dominion Bureau of Statistics.
Natural gas was first discovered in New Brunswick in 1859. In 1883, natural gas was discovered in southern Alberta, while Canada's first offshore discovery was made south of Sable Island, Nova Scotia, in 1967.
Following the Second World War, exploration and development in the oil and gas industry continued, particularly in the western provinces. Alberta became the main oil and gas producing province while, in Atlantic Canada, projects such as Hibernia, Terra Nova and Panuke launched the eastern seaboard onto the oil market.
Over the years, production continued to increase. During Canada's centennial year, production exceeded 55 million cubic metres of crude oil (and equivalent products), mostly through conventional methods, and 37 billion cubic metres of natural gas.
In 2016, Canada produced over 225 million cubic metres of crude oil and equivalent products, with more than 60% coming from non-conventional sources (oil sands), while marketable natural gas production exceeded 160 billion cubic metres.
Note to readers
The Annual Oil and Gas Extraction Survey was migrated to the Integrated Business Statistics Program for the 2014 reference year. As a result, the Annual Oil and Gas Extraction Survey program will begin disseminating its data in CANSIM tables 136-0001 (oil and gas extraction capital expenditures and operating costs) and 136-0002 (oil and gas extraction revenues, expenses and balance sheet) starting with the 2015 reference year.
The oil and gas extraction industry includes establishments primarily engaged in operating oil and gas field properties. This includes the production and extraction of oil from oil shale and oil sands.
Crude oil and equivalent products include crude oil, crude bitumen, synthetic crude oil and condensate.
Conventional oil and gas extraction includes establishments primarily engaged in the production of petroleum or natural gas from wells in which the hydrocarbons will initially flow or can be produced using normal pumping techniques.
Non-conventional oil and gas extraction includes establishments primarily engaged in producing crude oil from surface shales, oil sands or from reservoirs in which the hydrocarbons are semisolids and conventional production methods are not possible.
Natural gas by-products include ethane, propane, butane and pentanes plus. Elemental sulphur is not included.
Other assets include all assets not reported as either current or capital assets.
Other liabilities include all liabilities not reported as either a current liability or long-term debt.
Raw Materials Price Index
Data for the Raw Materials Price Index were taken from CANSIM table 330-0008.
Data for 2015 have been revised.
Contact information
For more information, or to enquire about the concepts, methods or data quality of this release, contact us (toll-free 1-800-263-1136; 514-283-8300; STATCAN.infostats-infostats.STATCAN@canada.ca) or Media Relations (613-951-4636; STATCAN.mediahotline-ligneinfomedias.STATCAN@canada.ca).
- Date modified:


