Chart 3
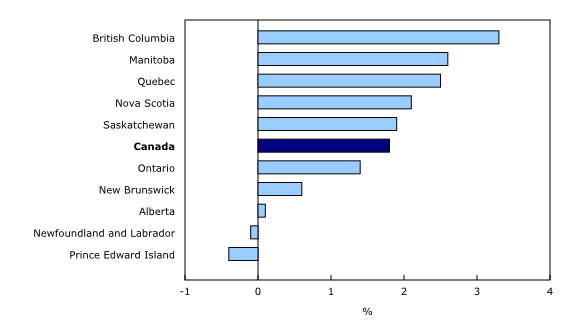
Year-over-year change in average weekly earnings by province, July 2017

Source(s):
CANSIM table 281-0049.
Chart description
This is a bar clustered chart.
| % | |
|---|---|
| British Columbia | 3.3 |
| Manitoba | 2.6 |
| Quebec | 2.5 |
| Nova Scotia | 2.1 |
| Saskatchewan | 1.9 |
| Canada | 1.8 |
| Ontario | 1.4 |
| New Brunswick | 0.6 |
| Alberta | 0.1 |
| Newfoundland and Labrador | -0.1 |
| Prince Edward Island | -0.4 |
Source(s):
CANSIM table 281-0049.
- Date modified: