Wholesale trade, May 2017
Archived Content
Information identified as archived is provided for reference, research or recordkeeping purposes. It is not subject to the Government of Canada Web Standards and has not been altered or updated since it was archived. Please "contact us" to request a format other than those available.
Released: 2017-07-24
$61.6 billion
May 2017
0.9% 
(monthly change)
$421.5 million
May 2017
35.5% 
(monthly change)
$90.5 million
May 2017
16.5% 
(monthly change)
$900.2 million
May 2017
6.7% 
(monthly change)
$565.2 million
May 2017
6.2% 
(monthly change)
$10,985.5 million
May 2017
-0.2% 
(monthly change)
$31,508.3 million
May 2017
0.1% 
(monthly change)
$1,733.5 million
May 2017
1.2% 
(monthly change)
$2,268.5 million
May 2017
-1.2% 
(monthly change)
$6,763.7 million
May 2017
4.5% 
(monthly change)
$6,292.6 million
May 2017
1.1% 
(monthly change)
$23.9 million
May 2017
0.8% 
(monthly change)
$52.0 million
May 2017
4.3% 
(monthly change)
$8.5 million
May 2017
10.7% 
(monthly change)
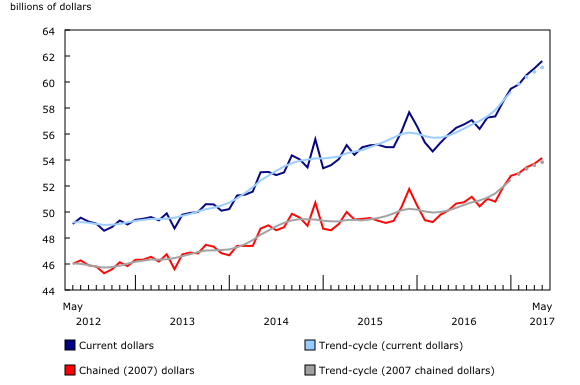
Wholesale sales rose 0.9% to a record high $61.6 billion in May. Sales were up in six of the seven subsectors, representing 80% of total wholesale sales. The miscellaneous subsector and the motor vehicle and parts subsector contributed the most to the advance.
In volume terms, wholesale sales increased 0.8% from April to May.
Sales increase in six of seven subsectors
The miscellaneous subsector reported the largest gain in dollar terms, up 2.6% to $8.0 billion in May following a 2.2% decline in April. Sales were up in four of the five industries, led by the agricultural supplies industry (+7.5%) following a 1.2% decline in April. The chemical (except agricultural) and allied product industry increased for the sixth time in seven months, up 8.4% in May.
Sales in the motor vehicle and parts subsector rose 1.4% to $11.6 billion following three consecutive monthly declines. The motor vehicle industry posted the lone increase (+1.9%) among the three industries.
In the food, beverage and tobacco subsector, sales rose 1.0% in May and surpassed the $12 billion mark for the first time. Higher sales in the food industry (+1.3%) contributed the most to the gain.
The personal and household goods subsector increased 0.6% to $8.5 billion, a sixth consecutive monthly gain. While sales were down in four of the six industries, the pharmaceuticals and pharmacy supplies industry more than offset these declines, rising 1.8% to $4.3 billion.
The machinery, equipment and supplies posted the lone decline in May, edging down 0.3% to $12.2 billion. The farm, lawn and garden machinery and equipment industry reported the largest decline in dollar terms, down 4.3% following a 22.2% gain in April.
Sales up in eight provinces
Wholesale sales were up in eight provinces in May, accounting for 78% of total wholesale sales. In dollar terms, Alberta and Newfoundland and Labrador led the gain.
Alberta recorded its seventh increase in eight months, with sales rising 4.5% to $6.8 billion—the highest level since April 2015. This was the largest monthly dollar gain in Alberta since July 2013. Sales were up in five subsectors, led by the machinery, equipment and supplies subsector.
Sales in Newfoundland and Labrador rose for the third time in four months, up 35.5% to $422 million in May, partially offsetting the 36.1% decline in April. While gains were widespread across subsectors, the miscellaneous subsector and the food, beverage and tobacco subsector were the largest contributors to the increase.
In British Columbia, sales grew 1.1% to a record high $6.3 billion, primarily on higher sales in the motor vehicle and parts subsector and the miscellaneous subsector.
Nova Scotia posted a third consecutive increase, with sales up 6.7% to a record high $900 million. Gains were recorded in five subsectors, led by the food, beverage and tobacco subsector.
Sales in New Brunswick rose 6.2% to $565 million, led by higher sales in the personal and household goods subsector.
Ontario recorded a sixth consecutive increase, edging up 0.1% to $31.5 billion. Gains in four subsectors, led by the motor vehicle and parts subsector, offset declines in the other subsectors, led by the machinery, equipment and supplies subsector.
Sales in Manitoba increased 1.2% to a record high $1.7 billion, led by the miscellaneous subsector. Sales in Prince Edward Island rose 16.5% to a record high $91 million, primarily on higher sales in the food, beverage and tobacco subsector. This was the third consecutive increase for both provinces.
In Saskatchewan, sales decreased for the first time in three months, down 1.2% to $2.3 billion in May, led by the machinery, equipment and supplies subsector.
Sales in Quebec edged down 0.2% to $11.0 billion, with declines in four subsectors. This was Quebec's first decrease in three months.
Inventories rise in May
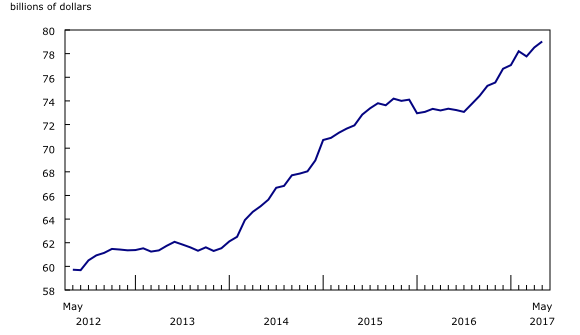
Wholesale inventories increased 0.6% to $79.0 billion in May, the ninth increase in ten months. Inventories were up in six of the seven subsectors, representing 73% of total wholesale inventories.
The building material and supplies subsector (+3.3%) posted the largest month-over-month increase in May. This subsector has also reported the largest year-to-date increase of all subsectors.
Inventories in the motor vehicle and parts subsector (+1.9%) increased for the fourth consecutive month, reaching its highest value on record.
The miscellaneous subsector (+1.5%) recorded its eighth consecutive increase. This subsector posted declines in ten consecutive months prior to the current upswing.
Inventories in the personal and household goods subsector (+0.3%) rose for the fifth time in six months.
The food, beverage and tobacco subsector (+0.3%) posted an increase for the third consecutive month.
Inventories in the machinery, equipment and supplies subsector (-1.7%) had the lone decrease in May.
The inventory-to-sales ratio declined from 1.29 in April to 1.28 in May. This ratio is a measure of the time in months required to exhaust inventories if sales were to remain at their current level.

In celebration of the country's 150th birthday, Statistics Canada is presenting snapshots from our rich statistical history.
Since wholesalers are the intermediaries in the economy, wholesale trade can be an excellent economic indicator of commercial activities in the country and between Canada and other countries.
The international oil price increases of 1972-1973 and 1979-1980 contributed greatly to economic slowdowns. In 1977, wholesale sales declined for the first time since 1953 while its share of gross domestic product (4.4%) was the lowest since 1954.
The high nominal and real interest rates in Canada after 1977 also contributed to the decline in 1981-1982. In 1981, five-year mortgage rates reached 21.5% while five-year guaranteed investment certificate rates hit 17.5%. Aside from 1977, wholesalers recorded their lowest year-over-year sale increase in 1982 (+1.4%) since 1958. From 1958 to 1982, the annual growth of Canadian wholesale trade averaged more than 10%.
Another downturn hit the Canadian economy in the early 1990s. For the first time since the Depression of the 1930s, wholesalers recorded consecutive annual price declines, falling 2.4% in 1991 and 2.1% in 1992.
A worldwide recession hit in late 2008 and early 2009. Although the Canadian economy was not as hard hit as other countries, Canadian wholesalers saw their sales decline by 5.2% in 2009 since they deal with exporters and importers.
Note to readers
All data in this release are seasonally adjusted and expressed in current dollars, unless otherwise noted. For information on seasonal adjustment, see Seasonally adjusted data – Frequently asked questions.
Total wholesale sales expressed in volume are calculated by deflating current dollar values using relevant price indexes. The wholesale sales series in chained (2007) dollars is a chained Fisher volume index with 2007 as the reference year. For more information, see Sales in volume for Wholesale Trade.
The Monthly Wholesale Trade Survey covers all industries within the wholesale trade sector as defined by the North American Industry Classification System (NAICS), with the exception of oilseed and grain merchant wholesalers (NAICS 41112), petroleum and petroleum products merchant wholesalers (NAICS 412) and business-to-business electronic markets, and agents and brokers (NAICS 419).
For information on trend-cycle data, see the StatCan Blog and Trend-cycle estimates – Frequently asked questions.
Real-time CANSIM tables
Real-time CANSIM tables 081-8011, 081-8012 and 081-8015 will be updated on July 31. For more information, consult the document Real-time CANSIM tables.
Next release
Wholesale trade data for June will be released on August 21.
Contact information
For more information, contact us (toll-free 1-800-263-1136; 514-283-8300; STATCAN.infostats-infostats.STATCAN@canada.ca).
For analytical information, or to enquire about the concepts, methods or data quality of this release, contact Farzana Choudhury (613-218-0349; farzana.choudhury@canada.ca), Manufacturing and Wholesale Trade Division.
- Date modified:


