Job Vacancy and Wage Survey, second quarter 2015
Archived Content
Information identified as archived is provided for reference, research or recordkeeping purposes. It is not subject to the Government of Canada Web Standards and has not been altered or updated since it was archived. Please "contact us" to request a format other than those available.
Released: 2015-11-27
There were 437,000 job vacancies in Canada in the second quarter and the job vacancy rate was 2.8%.
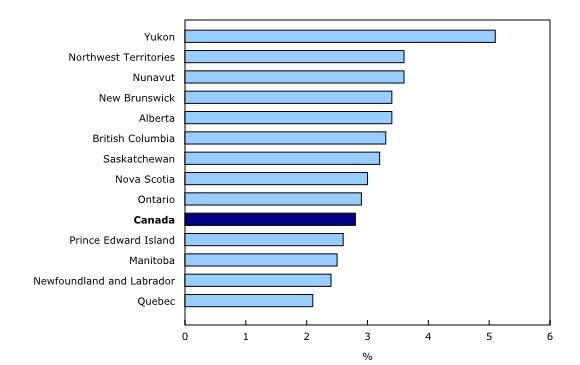
Job vacancy rates across Canada
The territories had the highest job vacancy rates in Canada, led by Yukon at 5.1%. The provinces with the highest rates were Alberta and New Brunswick (both at 3.4%). Quebec, at 2.1%, had the lowest job vacancy rate, followed by Newfoundland and Labrador (2.4%) and Manitoba (2.5%).
The job vacancy rate refers to the share of jobs that are unfilled out of all payroll jobs available. It represents the number of job vacancies expressed as a percentage of labour demand; that is, the sum of all occupied and vacant jobs.
Of the 10 economic regions with the highest job vacancy rates, 8 were in the western provinces and Yukon, while 8 of the 10 economic regions with the lowest job vacancy rates were in Quebec. There are 76 economic regions in Canada.
Provincial and territorial job vacancies
Ontario had the largest number of job vacancies in the second quarter, with 39.5% of all job vacancies in Canada, followed by Quebec with 15.9%. Ontario, Quebec, Alberta and British Columbia, the four provinces with the most job vacancies, had 86.5% of the national total, which is in line with their total proportion of employment.
Job vacancies by occupation
There are 140 occupational groups at the three-digit National Occupational Classification (NOC) level. Nationally at this level, food counter attendants, kitchen helpers and related support occupations had the most job vacancies in the second quarter at 26,000, followed by retail salespersons (25,000). Over half of job vacancies in these two occupational groups were part time. Together, the 10 three-digit NOC groups with the most job vacancies represented about 35% of the national total. Of these, computer and information systems professionals was the lone occupation group that sought a university degree for the majority of its vacancies.
There are 500 occupations at the four-digit NOC. At this level, 2 of the 10 occupations with the most job vacancies were related to seasonal industries. Specifically, construction trades helpers and labourers had 8,200 job vacancies and general farm workers had 7,000 job vacancies. About 65% of job vacancies for construction trades helpers and labourers were in Ontario and Alberta, while about 61% of job vacancies for general farm workers were in Ontario and British Columbia.
Job vacancies and offered hourly wage
The Job Vacancy and Wage Survey (JVWS) provides information on the wage offered for the job vacancies that businesses are trying to fill. Offered wage is expressed as an average of hourly rates. The wage offered by an employer for a vacant position may differ from the actual wage paid once a position is filled (see the JVWS Guide for a more detailed definition of average offered hourly wage).
Nationally, for the 437,000 job vacancies, the average wage offered was $18.80.
The offered wage varied notably by province and territory. In the second quarter, Nunavut ($28.00) and Northwest Territories ($25.35) had the highest wages offered for vacant positions, followed by Alberta ($19.85). Several factors can influence the wage employers are willing to offer for the positions they are trying to fill, such as skills and experience required, cost of living (for example, in remote areas), labour laws on minimum wage, and the existence of labour shortages.
In the second quarter, the Atlantic provinces had the lowest offered wage for vacant positions, ranging from $17.55 in Newfoundland and Labrador to $13.70 in Prince Edward Island.
Looking at the three-digit NOC level, physicians, dentists and veterinarians had the highest offered wage at $74.60. Nationally, half of the 10 occupational groups with the highest offered wage were in management. This included legislators and senior management ($63.65), managers in natural resources production and fishing ($50.00) as well as managers in health care ($48.80). Together, these 10 occupational groups with the highest offered wage represented about 6,000 job vacancies or 1.3% of total vacancies in Canada.
Among the 10 three-digit NOC groups that had the lowest offered wage for vacant positions, 1 was related to the agricultural sector and 6 were related to sales or accommodation and food. At this level, the 10 occupational groups with the lowest offered wage tended to require little formal education. These included occupations in food and beverage service ($10.35), cashiers ($11.15), as well as agriculture and horticulture workers ($11.90).
Of the 10 groups with the lowest offered wage, 4 were also among the 10 occupational groups with the largest number of job vacancies. Additionally, 7 of the 10 occupational groups with the lowest offered wage had more part-time than full-time job vacancies.
Job vacancies by education and job permanency
As part of this survey, employers are asked to report the minimum level of education sought for the job vacancies. In the second quarter, employers sought no minimum level of education for about 36% of vacant positions, while they sought a bachelor's degree or higher for about 11% of job vacancies. Over half of job vacancies with no educational requirements were part of the broad occupational group "sales and service occupations," which includes occupations such as salespersons, cashiers and support occupations in accommodation, travel and amusement services.
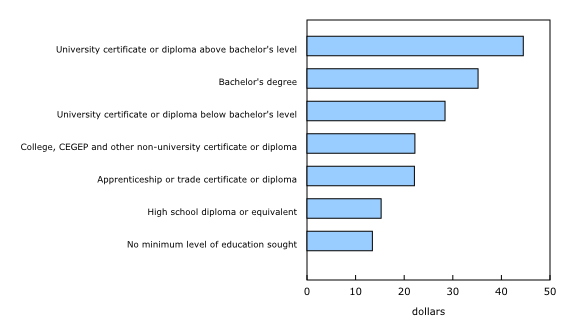
Job vacancies associated with higher education levels were generally matched with higher offered wages. Nationally, job vacancies that had no minimum level of education sought had an offered wage of $13.45, while those where employers sought a university certificate or diploma above the bachelor's level had an offered wage of $44.50.
In the second quarter, 72.3% of job vacancies in Canada were permanent positions. Of the 27.7% of job vacancies that were temporary positions, 71.5% were seasonal. At the three-digit NOC level, harvesting, landscaping and natural resources labourers had the most seasonal job vacancies at 8,400. Agriculture and horticulture workers (6,500) and athletes, coaches, referees and related occupations (5,300) also reported a high number of seasonal job vacancies.
Note to readers
The Job Vacancy and Wage Survey (JVWS) is a quarterly survey that provides comprehensive information on job vacancies by industry sector, detailed occupations and skill level sought for Canada, the provinces, territories and economic regions. With its broader scope and greater detail, the JVWS is Statistics Canada's foremost source of current and comprehensive information on job vacancies in Canada.
The JVWS, sponsored by Employment and Social Development Canada, is the largest survey on job vacancies ever conducted by Statistics Canada. It responds to key labour market information needs by providing critical data on current and emerging labour market demand. Results will support decision making by job seekers, students, employers and policy makers.
JVWS data are not seasonally adjusted.
Annual wage and employment data by occupation will be collected in the wage component of the survey starting in 2016.
Summary statistics related to the job vacancy time series from the Survey of Employment, Payroll and Hours are available in CANSIM.
Data quality of the Job Vacancy and Wage Survey
The target population of the survey includes all business locations in Canada, except for those primarily involved in religious organizations and private households. While federal, provincial and territorial administrations are also excluded from the survey for now, they will be phased in at a later date.
Next release
Job vacancy data from the JVWS for the third quarter of 2015 will be released in February 2016.
Products
Job vacancy data from the Job Vacancy and Wage Survey (5217) for the second quarter are now available upon request. CANSIM tables will be available at a future date.
More information about the concepts and use of data from the Job Vacancy and Wage Survey is available online in the Guide to the Job Vacancy and Wage Survey (75-514-G) from the Browse by key resource module of our website under Publications.
Contact information
For more information, contact us (toll-free 1-800-263-1136; 514-283-8300; STATCAN.infostats-infostats.STATCAN@canada.ca).
To enquire about the concepts, methods or data quality of this release, contact Elton Cryderman (613-951-4317; elton.cryderman@canada.ca) or Myriam Hazel (613-219-4345; myriam.hazel@canada.ca), Labour Statistics Division.
- Date modified:


