Chart 3
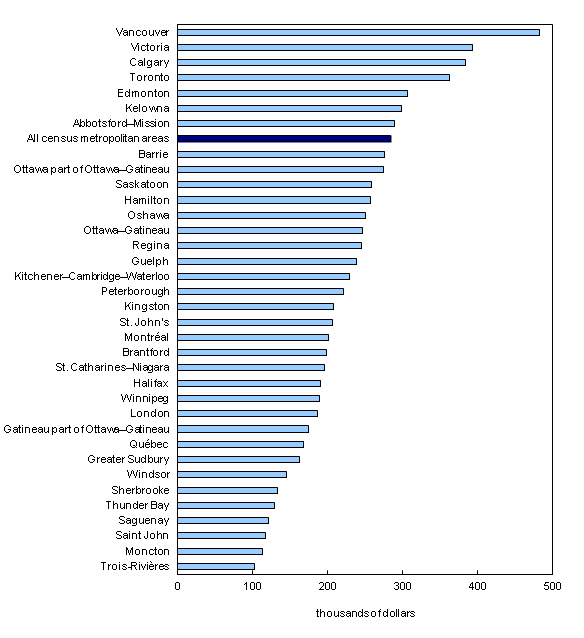
British Columbia and Alberta census metropolitan areas have highest values per private dwelling in 2011

Chart description
The title of the graph is "British Columbia and Alberta census metropolitan areas have highest values per private dwelling in 2011."
This is a bar clustered chart.
This is a horizontal bar graph, so categories are on the vertical axis and values on the horizontal axis.
There are in total 36 categories in the vertical axis. The horizontal axis starts at 0 and ends at 500 with ticks every 100 points.
There are 1 series in this graph.
The horizontal axis is "thousands of dollars."
The vertical axis is "Census metropolitan areas."
The title of series 1 is "Values per private dwelling, 2011."
The minimum value is 103.1 and it corresponds to "Trois-Rivières."
The maximum value is 482.8 and it corresponds to "Vancouver."
| thousands of dollars | |
|---|---|
| Vancouver | 482.8 |
| Victoria | 393.4 |
| Calgary | 384.5 |
| Toronto | 362.0 |
| Edmonton | 306.5 |
| Kelowna | 298.9 |
| Abbotsford–Mission | 288.6 |
| All census metropolitan areas | 283.7 |
| Barrie | 275.7 |
| Ottawa part of Ottawa–Gatineau | 274.1 |
| Saskatoon | 258.8 |
| Hamilton | 256.6 |
| Oshawa | 250.4 |
| Ottawa–Gatineau | 247.0 |
| Regina | 245.4 |
| Guelph | 238.1 |
| Kitchener–Cambridge–Waterloo | 229.5 |
| Peterborough | 221.0 |
| Kingston | 208.0 |
| St. John's | 206.1 |
| Montréal | 201.3 |
| Brantford | 198.9 |
| St. Catharines–Niagara | 195.3 |
| Halifax | 190.2 |
| Winnipeg | 189.6 |
| London | 186.3 |
| Gatineau part of Ottawa–Gatineau | 173.9 |
| Québec | 167.4 |
| Greater Sudbury | 162.6 |
| Windsor | 144.5 |
| Sherbrooke | 133.8 |
| Thunder Bay | 129.2 |
| Saguenay | 120.7 |
| Saint John | 117.4 |
| Moncton | 112.7 |
| Trois-Rivières | 103.1 |
- Date modified: