Farm Product Price Index

Archived Content
Information identified as archived is provided for reference, research or recordkeeping purposes. It is not subject to the Government of Canada Web Standards and has not been altered or updated since it was archived. Please "contact us" to request a format other than those available.
Related subjects
-
[an error occurred while processing this directive]
Prices farmers received for their commodities in July rose 14.8% from July 2010, as product prices for livestock and animal products and most crops continued to advance. July marked the seventh consecutive double-digit increase that has ranged from 12.2% to 18.9%.
In the 12 months to July, both the total crops index (19.4%) and the livestock and animal product index (10.4%) recorded increases. The year-over-year upward trend started in September 2010 for the crops index and in May 2010 for the livestock and animal products index.
The 12-month change in the Farm Product Price Index
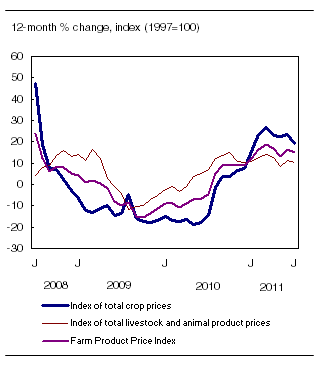
Chart description: The 12-month change in the Farm Product Price Index
The largest contributors to the advance in crop prices were oilseeds (+34.3%) and grains (+30.1%). The year-over-year increase of the crops index was moderated by lower prices for potatoes (-4.5%) and vegetables (-2.5%).
Canola, Canada's largest oilseed crop, set record crush levels for the August 2010 to July 2011 crop year, with 6.3 million tonnes of canola crushed, up 31.8% from the previous year's record.
Compared with July 2010, increases were recorded in all livestock commodities, ranging from 1.8% for dairy to 16.7% for poultry. The cattle and calves index (+15.7%), the largest contributor to the livestock and animal products index, continued its strong advance, with double-digit growth since August 2010.
On a monthly basis, following an increase in June, the July index fell 0.1%, the second decrease since December 2010. Both the crops index and the livestock and animal products index edged down in July.
Note: The growth rate of the total Farm Product Price Index (FPPI) is derived from a weighted average of the component indices using a different set of weights in consecutive months; it is not a weighted average of the growth rates of its crop and livestock components. Given this, the growth rate of the composite FPPI can lie outside the growth rate of these components.
Available on CANSIM: tables 002-0021 and 002-0022.
Definitions, data sources and methods: survey number 5040.
The July 2011 issue of Farm Product Price Index, Vol. 11, no. 7 (21-007-X, free), is now available from the Key resource module of our website under Publications.
For more information, or to order data, call Client Services (toll-free 1-800-465-1991). To enquire about the concepts, methods or data quality of this release, contact Gail-Ann Breese (204-983-3445; fax: 204-983-7543; gail-ann.breese@statcan.gc.ca), Agriculture Division.
- Date modified: