Common menu bar links
New Housing Price Index
Archived Content
Information identified as archived is provided for reference, research or recordkeeping purposes. It is not subject to the Government of Canada Web Standards and has not been altered or updated since it was archived. Please "contact us" to request a format other than those available.
Contractors' selling prices increased 0.1% in August following a 0.3% advance in July.
Between July and August, prices increased the most in St. John's (+1.1%) followed by Québec (+0.9%) and Regina (+0.8%).
In St. John's, some builders adjusted prices upward to be more in line with the value of land within the city.
In Québec, prices continued to increase as builders reported higher material and labour costs. Builders moving to new phases of development also raised their prices as the scarcity of available lots has been pushing up land value in this region.
The largest monthly decrease in new housing prices was recorded in Hamilton (-0.5%). Some builders lowered their prices to encourage sales while others offered bonus upgrade packages.
Monthly declines were also observed in Windsor (-0.4%) and Edmonton (-0.3%).
12-month change: Continued declines in the New Housing Price Index in Western Canada
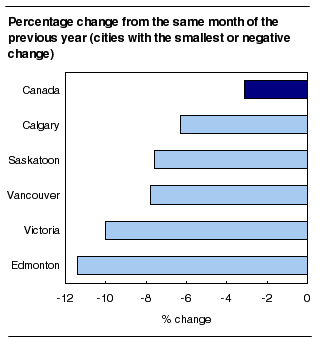
Year over year, the New Housing Price Index was down 3.1%. The largest declines remained in Western Canada, where prices decreased from highs registered in late 2007 and the beginning of 2008.
In the Prairie region, 12-month declines were recorded in Edmonton (-11.4%), Saskatoon (-7.6%) and Calgary (-6.3%).
On the West Coast, Victoria (-10.0%) and Vancouver (-7.8%) also posted year-over-year declines.
Over the past few months, some builders in Alberta and British Columbia have offered lower prices, bonuses and incentives to motivate sales in the face of weaker market conditions.

Among surveyed cities, the largest year-over-year increase was registered in St. John's (+7.5%). This was the 10th consecutive month that this city has led the way in year-over-year advances.
On a year-over-year basis, prices in Québec (+6.3%) and in Saint John, Fredericton and Moncton (+2.2%) increased, albeit at a slower pace than in previous months.
Compared with August 2008, contractors' selling prices were 1.8% higher in Regina. Charlottetown (+1.7%) and Winnipeg (+1.6%) also posted increases.

Available on CANSIM: table 327-0005.
Definitions, data sources and methods: survey number 2310.
The second quarter 2009 issue of Capital Expenditure Price Statistics (62-007-X, free) will soon be available.
For more information, or to enquire about the concepts, methods or data quality of this release, contact Client Services (613-951-9606; toll-free 1-866-230-2248; fax: 613-951-3117; prices-prix@statcan.gc.ca), Producer Prices Division.
Table 1
| August 2009 | August 2008 to August 2009 | July to August 2009 | |
|---|---|---|---|
| (1997=100) | % change | ||
| Canada total | 153.7 | -3.1 | 0.1 |
| House only | 161.4 | -3.9 | 0.2 |
| Land only | 137.7 | -1.8 | -0.1 |
| St. John's | 183.1 | 7.5 | 1.1 |
| Charlottetown | 121.2 | 1.7 | 0.2 |
| Halifax | 150.5 | 0.5 | 0.0 |
| Saint John, Fredericton and Moncton | 120.5 | 2.2 | 0.1 |
| Québec | 167.0 | 6.3 | 0.9 |
| Montréal | 165.3 | 1.2 | 0.0 |
| Ottawa–Gatineau | 169.7 | 0.6 | 0.0 |
| Toronto and Oshawa | 145.0 | -1.0 | 0.2 |
| Hamilton | 150.2 | -1.6 | -0.5 |
| St. Catharines–Niagara | 155.1 | -1.7 | 0.1 |
| London | 144.4 | 0.8 | 0.0 |
| Kitchener | 142.8 | 0.3 | 0.1 |
| Windsor | 103.8 | 0.1 | -0.4 |
| Greater Sudbury and Thunder Bay | 112.7 | 0.1 | 0.0 |
| Winnipeg | 183.1 | 1.6 | 0.1 |
| Regina | 252.9 | 1.8 | 0.8 |
| Saskatoon | 211.7 | -7.6 | 0.1 |
| Calgary | 230.5 | -6.3 | 0.2 |
| Edmonton | 207.6 | -11.4 | -0.3 |
| Vancouver | 114.5 | -7.8 | 0.2 |
| Victoria | 106.5 | -10.0 | 0.4 |

