Environmental taxes in Canada, experimental estimates, 2010 to 2018
Released: 2023-05-05
$29 billion
2018
The new experimental Environmental tax statistics (ETS) product records the revenue governments received from environmental taxes paid by industries, government institutions, non-profit organizations and households, and received from gross fixed capital formation. The ETS records only transfers to government and does not record any returns, such as the carbon tax rebate that is received by households in some provinces.
Four broad categories of environmental taxes are recognized: energy, transportation, pollution and natural resources. For the purpose of this product, environmentally related taxes are taxes whose tax base is a physical unit (or a proxy of it) of something that has a proven, specific, negative impact on the environment (as per the United Nations definition).
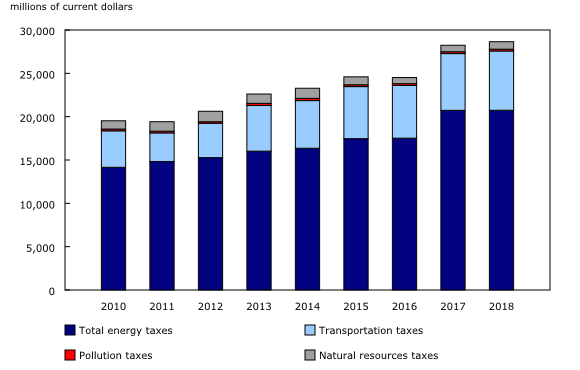
Total environmental taxes generated in Canada reached $29 billion in 2018, a 1% increase from 2017. Overall, in 2018, these taxes represented one-tenth of total taxes on products and on production.
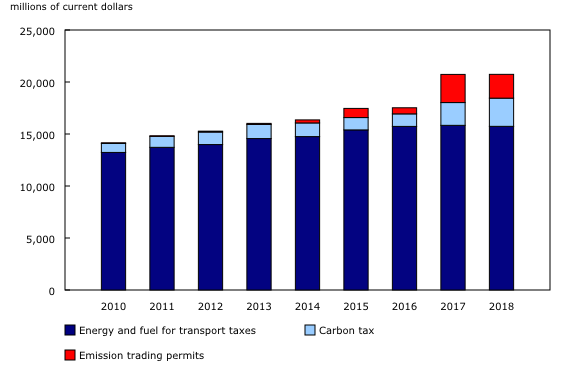
Energy taxes include taxes on energy and fuel for transport (e.g., gasoline, diesel and natural gas), carbon taxes and emission trading permits. Examples of transportation taxes are personal and commercial motor vehicle registration taxes. Pollution taxes cover, among others, fees on ozone-depleting substances and pollutant emissions to air, as well as recycling fees like tire eco fees. Hunting and fishing licenses are examples of natural resources taxes.
Energy tax category drives environmental tax revenue
Of the $29 billion total in total environmental taxes, close to three-quarters (72%; $21 billion) were attributable to energy taxes in 2018. An additional 24% were attributable to transportation taxes, 3% reflected natural resources taxes, and 1% were from pollution taxes.
Over the time series, energy tax revenue was by far the largest contributor to environmental taxes at the national level and consistently represented over 70% of the total.
Adoption of new taxes results in increased revenues in 2013
A year-over-year increase of 33% in the transportation tax category was observed in 2013. This was driven by the introduction of the new federal air transportation tax that same year, combined with an increase in revenues collected from the federal custom import tax as a result of an increase in goods and services imports that had an environmental tax component.
This combination also resulted in a 41% increase in revenue in the pollution tax category that same year (from $178 million in 2012 to $250 million in 2013).
Industry sector environmental tax revenue edges out household sector
In 2018, just over half (52%) of environmental taxes were paid by the industry sector, followed by households (47%), and the remaining 1% was attributable to gross fixed capital formation. However, households had a slightly greater share for six of the seven years from 2010 to 2016.
Ontario accounts for the largest share of environmental taxes
In 2018, Ontario contributed for one-third (33%) of the total environmental taxes collected, followed by Quebec (21%), Alberta (17%) and British Columbia (15%).
The shares of these four main contributors remained relatively stable over the time series. Ontario reached its highest share in 2017 (36%), while Alberta reached its peak in 2018 (17%).
Note to readers
This first release of the Environmental tax statistics (ETS) provides annual estimates of environmental taxes in current dollars at the national level and by province and territory for the 2010 to 2018 reference years, with annual updates thereafter.
The ETS measures the revenue received by governments from environmental taxes paid by industry (industries, government institutions and non-profit organizations), households, and by gross fixed capital formation.
This product records transfers from businesses and households to government and does not record any returns, such as the carbon rebate that is received by households in some provinces.
Results for the ETS are in line with Statistics Canada's environmental taxes submission to the International Monetary Fund. Discrepancies arise mainly from presenting the ETS estimates by calendar year than by fiscal year.
The environmental tax amounts are reported for four main categories: energy taxes, transportation taxes, pollution taxes and natural resource taxes. Energy taxes can also be broken down into three subcategories: energy and fuel for transport, carbon taxes and emission trading permits. Carbon taxes are a tax charge placed on greenhouse gas emissions released mainly from burning fossil fuels. Taxes on greenhouse gas emissions other than carbon dioxide are also included. Emission trading permits record government revenue from the auctioning of emissions permits (also known as "cap and trade"), which are treated as taxes on production in the national accounts.
Development of this product follows the United Nations System of Environmental-Economic Accounts—Central Framework 2012. For more information, see the page Canadian System of Environmental-Economic Accounts—ETS—5376. Due to the experimental nature of this release, comments and feedback are welcome.
Contact information
For more information, or to enquire about the concepts, methods or data quality of this release, contact us (toll-free 1-800-263-1136; 514-283-8300; infostats@statcan.gc.ca) or Media Relations (statcan.mediahotline-ligneinfomedias.statcan@statcan.gc.ca).
- Date modified:


