Aquaculture, 2021 (final)
Released: 2022-11-29
Recovery of Canadian aquaculture industry in 2021, increased production and value
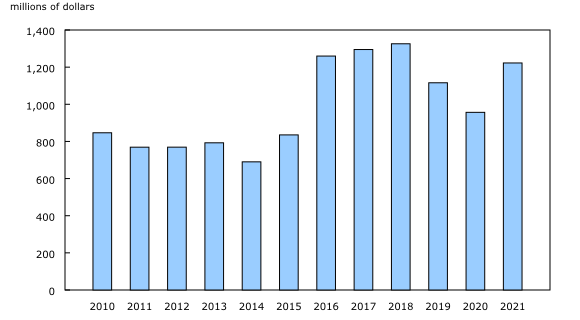
Sales of aquaculture products and services rose 28.1% from the previous year to $1.4 billion in 2021, as the food service and hospitality industries began to recover amid the easing of COVID-19 pandemic restrictions in certain jurisdictions. This growth in sales was primarily because of increased finfish and shellfish production, as well as higher national prices for finfish products.
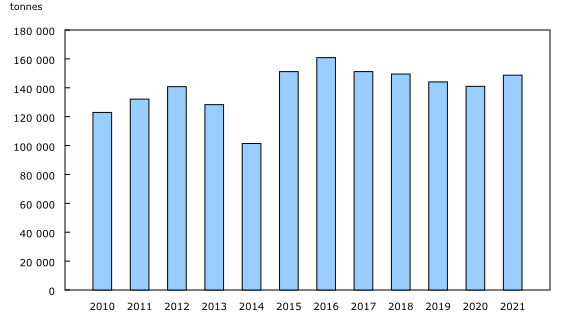
At the national level, finfish production in 2021 increased 5.5%, compared with 2020, to 148 710 tonnes. Average Canadian finfish product prices rose 21.2%, from $6.78 per kilogram in 2020 to $8.22 per kilogram in 2021, primarily driven by salmon prices returning to pre-pandemic levels. National shellfish production in 2021 reached 42 540 tonnes, up 40.7% from 2020. Meanwhile, Canadian farmed shellfish prices fell 1.7% year over year to $2.88 per kilogram as a result of increased production, yet remained well above historical prices.
From 2020 to 2021, gross output for the aquaculture industry increased 17.7% to $1.3 billion, while total product inputs rose 10.9% to $1.1 billion. The gross value added, which is the difference between gross output and total product inputs, grew 61.7% to $243.1 million.
Strong finfish sales on East and West Coast
Finfish production in British Columbia, which accounted for 58.2% of Canadian farmed finfish production in 2021, decreased 7.5% from 2020. Despite this decline, strong salmon prices lifted finfish revenues in the province 10.4% higher than the previous year.
After two consecutive years of low production in the Atlantic provinces related to challenging biological conditions (mass mortality, algal blooms and infectious salmon anemia), finfish production grew 35.2% in 2021, compared with the previous year. An increase in harvest volumes and resurgent finfish prices in the larger finfish-producing provinces boosted finfish sales in Newfoundland and Labrador (+167.8%) and in New Brunswick (+90.6%), relative to 2020.
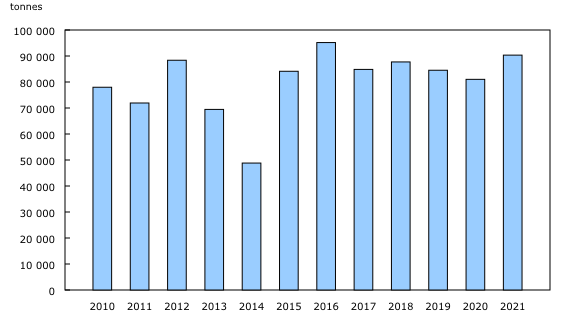
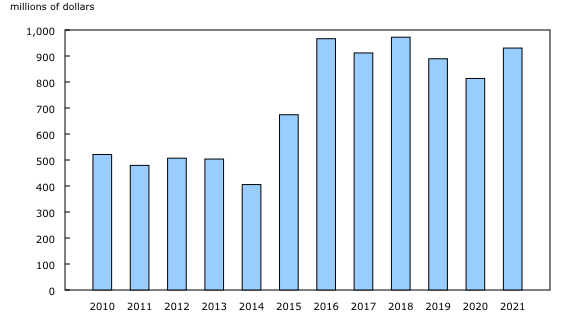
In 2021, export quantities for farmed Atlantic salmon, including fillets, increased 11.5% from 2020. Export prices also rose 2.6% from a year earlier to $10.30 per kilogram, yielding a 14.4% increase in sales to $930.5 million. The United States was the largest importer of Canadian farmed Atlantic salmon, accounting for 96.4% of total exports by quantity in 2021.
Prince Edward Island leads recovery of shellfish industry in Canada
After a 21-year low in farmed shellfish production in Canada in 2020, the industry recovered with a strong year in 2021. With restaurants across most of Canada reopening in the spring and summer of 2021, demand was strong for shellfish in the food service industry. Prince Edward Island, the country's primary producer of farmed shellfish (accounting for 57.1% of the national total in 2021), increased production by 39.6% in 2021 compared with the previous year. Sales of farmed shellfish in Canada—which accounted for 9.1% of the total sales of aquaculture products and services in 2021—increased to $122.3 million (+38.3% compared with 2020).
Prince Edward Island, also the largest producer of mussels in Canada, harvested 33.5% more mussels than in 2020, at 17 025 tonnes. British Columbia, the largest producer of oysters, produced 7 997 tonnes of oysters (+55.1% from 2020).
2021 also saw an uptick in the global demand for Canadian mussels, as the food service and hospitality industries began recovering in the United States and abroad. Export quantities rose 36.4% from 2020, and while export prices declined 5.6% from a year ago, the total value of exports was up 28.8% to $48.2 million.
Note to readers
Aquaculture production and value data are provided annually by each of the provincial ministries responsible for aquaculture. Producers must report their production and value as part of their provincial licensing agreements.
Canadian export statistics are obtained from administrative records.
Revenue, expense and inventory data come from the 2021 Annual Survey of the Aquaculture Industry.
The publication Aquaculture Statistics was discontinued on November 17, 2016. All the data for this product can be found in tables 32-10-0107-01: Aquaculture, production and value; 32-10-0108-01: Aquaculture economic statistics, value added account; and 32-10-0005-01: Aquaculture, exports of selected Canadian aquaculture products, by destination.
Contact information
For more information, or to enquire about the concepts, methods or data quality of this release, contact us (toll-free 1-800-263-1136; 514-283-8300; infostats@statcan.gc.ca) or Media Relations (statcan.mediahotline-ligneinfomedias.statcan@statcan.gc.ca).
- Date modified:


