Monthly Mineral Production Survey, September 2022
Released: 2022-11-21
Value of mineral shipments decreases in the third quarter
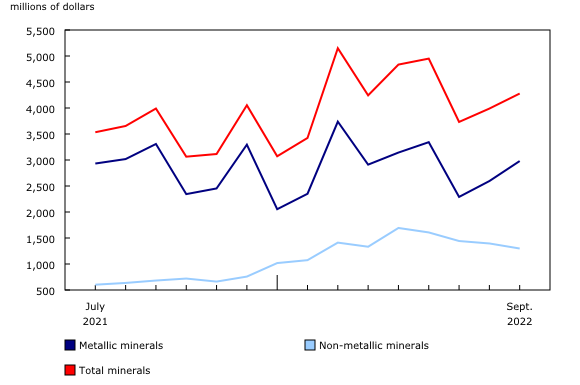
The value of mineral shipments decreased by 14.5% in the third quarter of 2022 ($12.0 billion) compared with the second quarter ($14.0 billion). In contrast, the value of mineral shipments increased by 7.5% in the third quarter compared with the same quarter in 2021 ($11.2 billion).
On a monthly basis, the decrease observed in July outweighed the increases that occurred in both August and September. The value of mineral shipments was $3.7 billion in July, decreasing 24.6% compared with June. The value of mineral shipments increased by 6.9% in August, reaching $4.0 billion. With a 7.2% increase in September, the value of mineral shipments at the end of the third quarter was $4.3 billion.
Gold and copper lead the rebound in the shipment value of metallic minerals in August and September
In comparison with the second quarter, the shipment value of metallic minerals declined by 16.3% in the third quarter.
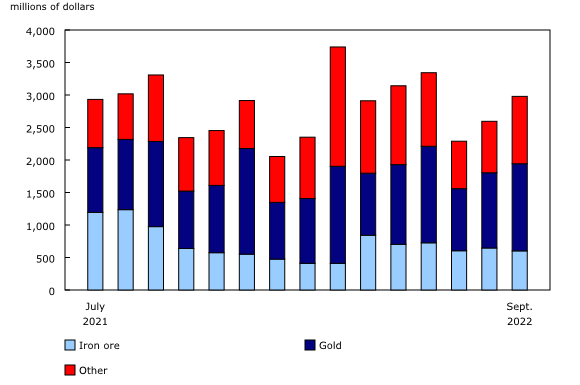
On a monthly basis, the shipment value fell by 31.5% at the beginning of the quarter to $2.3 billion in July, down from $3.3 billion in June. The shipment value then climbed by 13.3% in August, totalling $2.6 billion. This increase was followed by a further rise of 14.8% in September, bringing the shipment value of metallic minerals to $3.0 billion at the end of the third quarter. These gains were insufficient to halt the decline during the quarter.
In July, the decline in the shipment value of metallic minerals was led by gold (-35.7% or -$529 million); iron concentrate (-35.9% or -$142 million); and several critical minerals, including copper (-45.6% or -$265 million), nickel (-44.0% or -$130 million) and cobalt (-42.8% or -$11 million).
In August, the shipment value of metallic minerals recovered as gold (+21.2% or +$202 million), iron concentrates (+71.6% or +$181 million) and critical minerals, like copper (+20.6% or +$65 million) and nickel (+16.4% or +$27 million), all increased. In contrast, the shipment value of zinc (-47.3% or -$24 million) decreased.
In September, the growth in the shipment value of metallic minerals was led by gold shipment, which grew 15.8% or $183 million. Critical minerals, such as copper (+25.8% or +$98 million), nickel (+15.4% or +$30 million) and cobalt (+32.3% or +$4 million), also contributed to the increase.
Shipment value of non-metallic minerals trends downward in the third quarter
The shipment value of non-metallic minerals decreased 10.7% in the third quarter of 2022 compared with the second quarter. On a monthly basis, there were successive declines in July (-10.3%), August (-3.3%) and September (-6.9%).
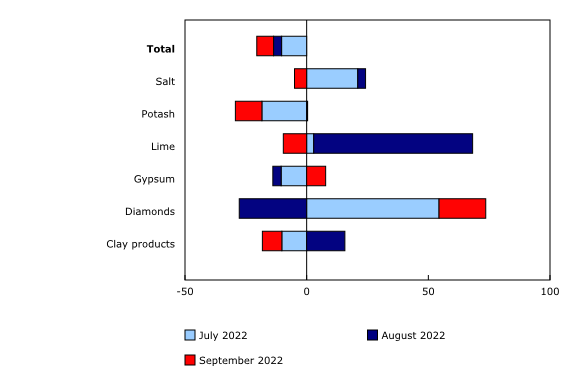
In July, the commodity with the biggest monthly decline was potash, which decreased 18.4% or $255 million compared with June. Conversely, the commodities with the largest monthly increases were diamonds (+54.4% or +$83 million) and salt (+21.0% or +$8 million).
In August, the commodity with the largest monthly decrease compared with July was diamonds (-27.7% or -$65 million). Although there were monthly increases in lime (+65.3% or +$10 million) and potash (+0.4% or +$5 million), these values were insufficient to counter the drop in the shipment value of non-metallic minerals in August.
In September, the monthly decrease in the shipment value of non-metallic minerals was due to potash (-10.9% or -$124 million) and lime (-9.6% or -$3 million). In contrast, the shipment value of diamonds increased (+19.2% or +$33 million).
Note to readers
The Monthly Mineral Production Survey estimates the production, shipments and inventories of Canada's leading minerals.
The Monthly Survey of Smelters and Metal Refineries covers smelters and metal refineries for a variety of base metals, including copper, lead, nickel and zinc.
The Monthly Mineral Production Survey is conducted as part of the Integrated Business Statistics Program and the Minerals and Metals Production Statistics Program modernization initiative.
Data from the Monthly Mineral Production Survey and the Monthly Survey of Smelters and Metal Refineries are released every month, and a detailed review is released every three months, in the month ending the quarter.
Data are not seasonally adjusted.
Data for the previous two months are subject to revision based on late responses. Data for July and August 2022 have been revised with this release.
Data for years prior to 2020 can be found on the Production of Canada's Leading Minerals page of the Natural Resources Canada website.
Data on energy consumption in the mining industries, from the Annual Mineral Production Survey, are now available for reference year 2019 and 2020 in tables 16-10-0029 and 16-10-0030.
The description and the new table view 16-10-0021-02 now identify 31 critical minerals listed by Natural Resources Canada. Critical minerals include aluminum, antimony, bismuth, cesium, chromium, cobalt, copper, fluorspar, gallium, germanium, graphite, helium, indium, lithium, magnesium, manganese, molybdenum, nickel, niobium, platinum group metals, potash, rare earth elements, scandium, tantalum, tellurium, tin, titanium, tungsten, uranium, vanadium and zinc. Critical minerals are the building blocks for the green and digital economy, being essential in a wide range of products, such as mobile phones, solar panels, electric vehicle batteries and medical applications. For more information on critical minerals, consult Natural Resources Canada at: Critical minerals in Canada - Canada.ca.
The value of shipments facilitates comparisons between mineral commodities as the units of measure of quantities produced or shipped vary drastically from one mineral to another (for example, iron in millions of tonnes versus diamonds in carats).
Contact information
For more information, or to enquire about the concepts, methods or data quality of this release, contact us (toll-free 1-800-263-1136; 514-283-8300; infostats@statcan.gc.ca) or Media Relations (statcan.mediahotline-ligneinfomedias.statcan@statcan.gc.ca).
- Date modified:


