Aircraft movement statistics: Major airports, July 2022
Released: 2022-09-29
524,233
July 2022
24.6% 
(year-over-year change)
Highlights
In July, Canada's major airports recorded a total of 524,233 aircraft movements. This was an increase of 24.6% from July 2021 and the first time in over two and a half years that movements have exceeded half a million.
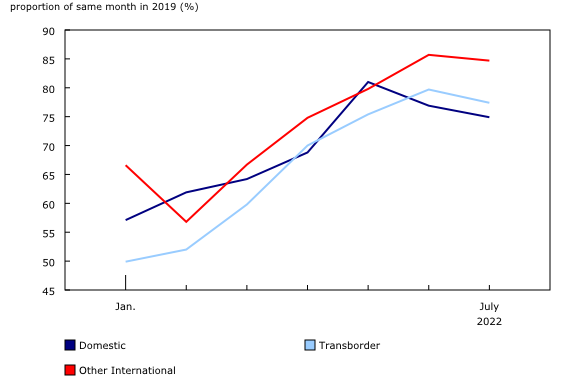
Despite this growth, the pace of recovery slowed in July as airports continued to experience congestion. Of the levels from July 2019, before the COVID-19 pandemic, domestic movements by Level I-III and foreign carriers reached 80.4%, movements to and from the United States increased to reach 75.9% and other international traffic to 82.9%.
Toronto/Lester B. Pearson International remained Canada's busiest airport, and Montréal/Pierre-Elliot-Trudeau International returned to be among the top five busiest airports for the first time since January 2022.
Major carriers reduce summer schedules
As the largest airports continued to struggle with labour shortages amid surging travel demand, two major carriers announced reduced flight schedules for July and August. In addition to suspending some flights altogether, one carrier noted it would be lowering the frequency of evening and late-night flights by smaller aircraft on both domestic and US routes.
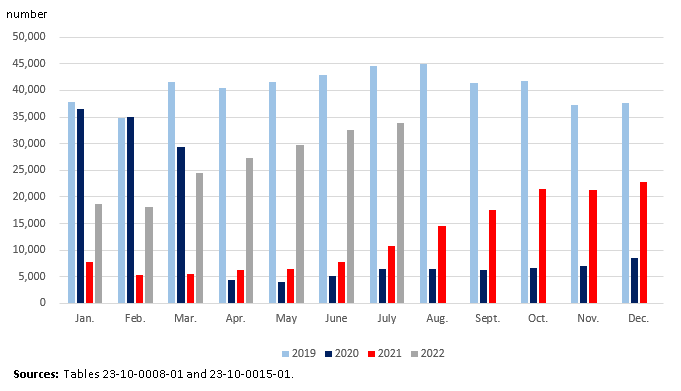
Commercial passenger flights have been the most impacted by these labour shortages at Toronto/Lester B. Pearson International Airport, with delays and cancellations widely reported. Indeed, total take-offs and landings at Pearson drifted further from pre-pandemic levels in July (77.6% of July 2019) compared with June (79.5% of June 2019).
Aircraft movements recover and exceed half a million
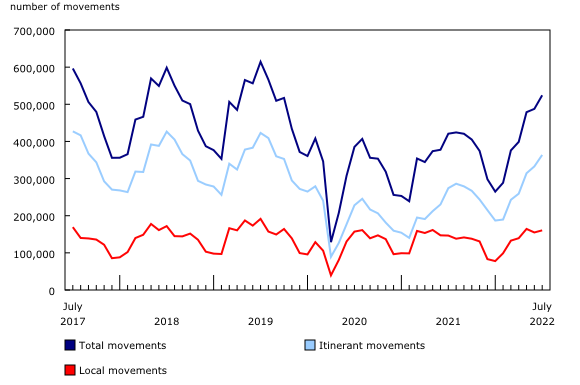
Total aircraft movements (take-offs and landings) at the 90 airports with NAV CANADA towers and flight service stations totalled 524,233 in July. This was an increase of 24.6% from July 2021 and the first time in over two and a half years that movements have exceeded half a million.
Itinerant movements (from one airport to another) were up 32.6% year over year to reach 363,663, and local movements (within the vicinity of the airport) were up 9.5% to 160,570.
Total aircraft movements recovered 85.3% of the July 2019 level, before the pandemic. Itinerant movements were at 86.0% of the pre-pandemic level and local movements at 83.8%.
On March 11, 2020, COVID-19 was declared a pandemic by the World Health Organization and, in the months that followed, total aircraft movements remained well below historical levels. Unless otherwise specified, comparisons are made with the same month of 2019 (also referred to as "pre-pandemic"), when aircraft movement levels were in line with historical trends.
Recovery slows amidst travel congestion
Domestic flights (within Canada) have been among those most affected by cancellations during the 2022 summer season. After five consecutive months of growth, domestic movements by Level I-III and foreign carriers recorded a lower proportion (80.4%) in July relative to the same month in 2019 than in June 2022 (relative to June 2019) (83.6%).
In July, transborder traffic (to and from the United States) reached 75.9% of its pre-pandemic (July 2019) level, relatively unchanged from the 75.7% recovery rate in June. Other international movements (outside the United States) reached 82.9%, similar to the 82.4% rate recorded in June.
Busiest airports
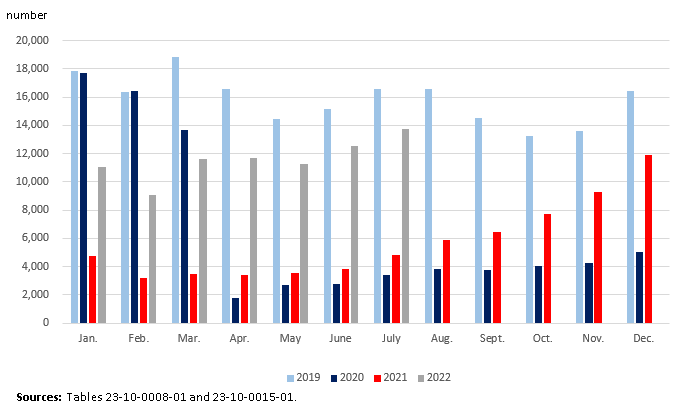
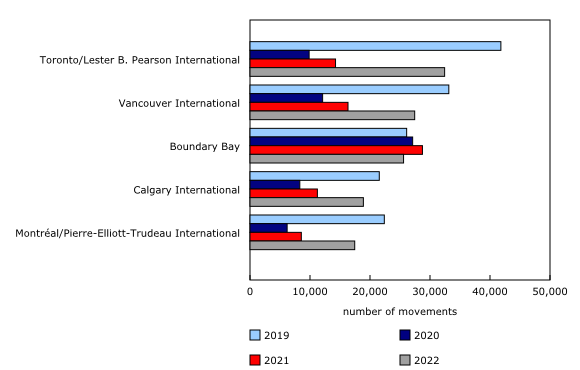
Canada's most active airports in July remained similar to the previous month, with Toronto/Lester B. Pearson International (32,435 movements), Vancouver International (27,448) and Boundary Bay (25,594) rounding out the top three. Montréal/Pierre-Elliot-Trudeau (17,451) moved back into the top five for the first time since January 2022.
Note to readers
The Aircraft Movement Statistics: Major Airports Survey collects data on itinerant and local aircraft movements at major airports in Canada.
Major airports include all airports with either a NAV CANADA air traffic control tower or a NAV CANADA flight service station.
An aircraft movement is defined as a take-off, landing or simulated approach by an aircraft, as defined by NAV CANADA.
Data for July 2021 may have been revised.
The data in this monthly release are not seasonally adjusted.
Contact information
For more information, or to enquire about the concepts, methods or data quality of this release, contact us (toll-free 1-800-263-1136; 514-283-8300; infostats@statcan.gc.ca) or Media Relations (statcan.mediahotline-ligneinfomedias.statcan@statcan.gc.ca).
- Date modified:

