Aircraft movement statistics: Major airports, February 2022
Released: 2022-04-28
288,568
February 2022
20.8% 
(year-over-year change)
Highlights
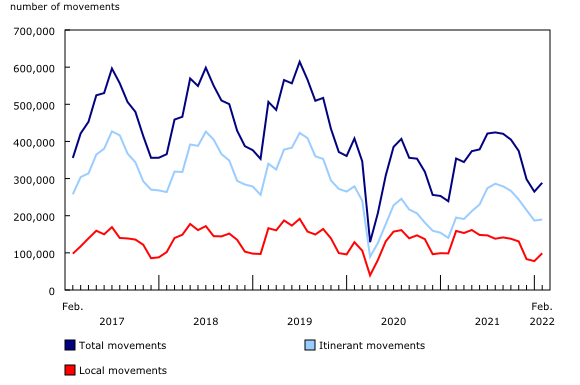
In February, there were 288,568 aircraft movements at Canada's major airports. This was an increase of 20.8% from the same month in 2021, and more than four-fifths (81.7%) of the number recorded during the same month in 2019, before the COVID-19 pandemic.
When compared with February 2019, movements within Canada and to the United States both saw improvements from January 2022, while other international traffic drifted further from pre-pandemic levels.
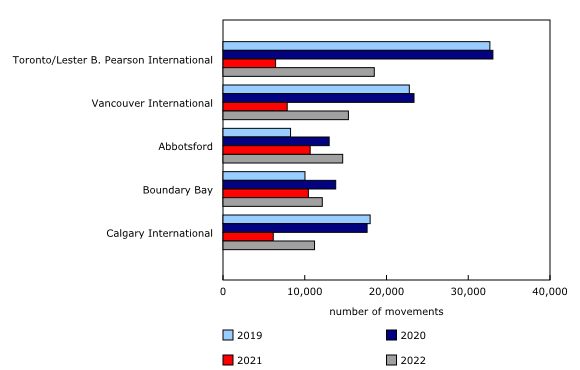
Toronto/Lester B. Pearson International was Canada's busiest airport in February 2022.
Schedules reduced as travel restrictions continue
Late last year, in response to the Omicron variant, the Government of Canada advised Canadians to avoid non-essential travel outside Canada and required all travellers entering Canada to provide a negative COVID-19 molecular test for entry.
As a result of these restrictions, larger passenger airlines reduced schedules. For example, Air Canada suspended flights to at least 14 Caribbean destinations from January 24 to April 30, 2022 and other major carriers also cancelled or consolidated flights in February.
In mid-February 2022, the Canadian Government announced a phased easing of travel requirements, to take effect at the end of the month. While these changes will not be reflected in February, the impact can be seen in recent releases of Weekly aircraft movement statistics.
Total movements in February
There were 288,568 total aircraft movements (take-offs and landings) at the 90 airports with NAV CANADA towers and flight service stations in February, 20.8% higher than in February 2021. Itinerant movements (from one airport to another) rose 35.1% to 189,644, and local movements (within the vicinity of the airport) were virtually unchanged (+0.3%) at 98,924.
Aircraft movements in February 2022 were 18.3% below the amount recorded in February 2019, before the pandemic began. Itinerant movements were 26.0% below while local movements were up 2.1%.
On March 11, 2020, COVID-19 was declared a pandemic by the World Health Organization and, in the months that followed, total aircraft movements remained well below historical levels. Unless otherwise specified, comparisons are made with the same month of 2019 (also referred to as "pre-pandemic"), when aircraft movement levels were in line with historical trends.
Domestic and international movements
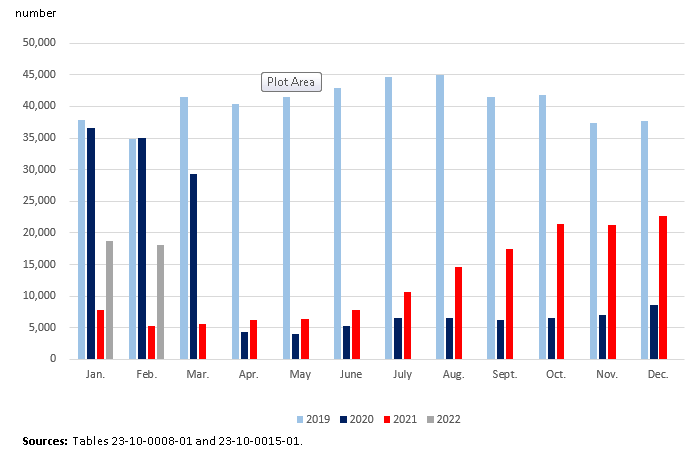
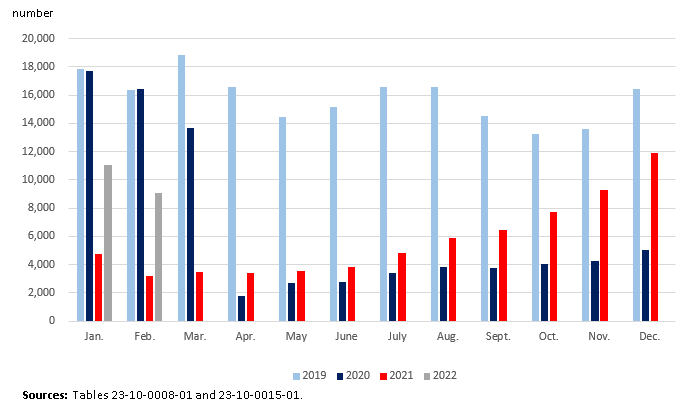
Total domestic movements (within Canada) in February 2022 were almost four-fifths (79.2%) of those recorded in February 2019. Domestic movements by Level I-III and foreign carriers within Canada were roughly two-thirds (66.8%) of the level recorded before the pandemic (February 2019), an improvement from January (62.9% of January 2019).
In February 2022, transborder (to and from the US) movements stood at just over half (52.0%) of their pre-pandemic levels (February 2019), a slight improvement from January's 49.5%. Conversely, other international traffic continued to falter, as movements in February were at 55.5% of their pre-pandemic level, down from the 61.9% recorded the previous month.
On a monthly basis, both domestic movements by Level I-III and foreign carriers and transborder movements showed seasonal declines in line with historical averages from 2015 to 2019, while other international traffic declined more sharply (-17.8%) than the historical average (-8.5%).
Busiest airports
Canada's most active airports in February were Toronto/Lester B. Pearson International (18,504 movements), Vancouver International (15,341 movements) and Abbotsford (14,640 movements). Of the 10 airports reporting the largest increases from February 2019, 9 were located in British Columbia.
Note to readers
The Aircraft Movement Statistics: Major Airports Survey collects data on itinerant and local aircraft movements at major airports in Canada.
Major airports include all airports with either a NAV CANADA air traffic control tower or a NAV CANADA flight service station.
An aircraft movement is defined as a take-off, landing or simulated approach by an aircraft, as defined by NAV CANADA.
Data for February 2021 may have been revised.
The data in this monthly release are not seasonally adjusted.
Contact information
For more information, or to enquire about the concepts, methods or data quality of this release, contact us (toll-free 1-800-263-1136; 514-283-8300; infostats@statcan.gc.ca) or Media Relations (statcan.mediahotline-ligneinfomedias.statcan@statcan.gc.ca).
- Date modified:


