Provincial and Territorial Cultural Indicators, 2019
Archived Content
Information identified as archived is provided for reference, research or recordkeeping purposes. It is not subject to the Government of Canada Web Standards and has not been altered or updated since it was archived. Please "contact us" to request a format other than those available.
Released: 2021-05-27
In 2019, nominal gross domestic product (GDP) of culture and sport in Canada increased 2.6% to $63.2 billion, representing 2.9% of the total economy. The culture sector generated $57.1 billion (or 90.4%) of this amount, while the remainder was attributable to sport.
In terms of employment, the culture and sport sectors accounted for just over 772,000 jobs in Canada, up 2.2% in 2019, with nearly all provinces posting gains. Over the same period, employment for the total economy grew 2.0%.
Although the economic and social landscape of Canada is very different at the time of this release than it was in 2019, these data provide a valuable baseline to better understand the potential impacts of COVID-19 in later reference years.
Culture GDP rises in 2019, with every province and territory posting gains
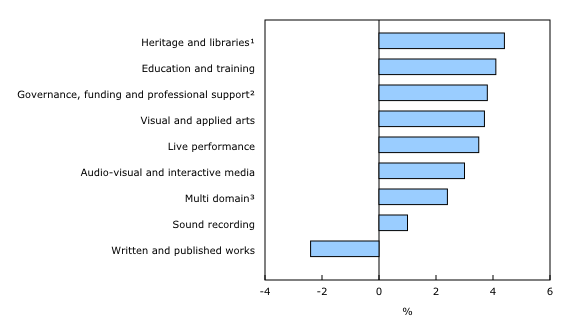
Culture GDP rose 2.5% to $57.1 billion in 2019. The visual and applied arts (+3.7%) and audio-visual and interactive media (+3.0%) domains, specifically the interactive media (+7.3%) and design (+4.8%) subdomains, continued to bolster the culture sector. Growth continued to be fuelled primarily by the design of software, video games, and graphics, as well as software and video game publishers. According to the digital and supply use tables, growth in Canada's digital industries has been strong over the last number of years.
Regionally, every province and territory reported gains, contributing to the increase in Canada's culture GDP.
The written and published works domain (-2.4%) recorded decreases, but these were smaller than in 2018. Since 2010, this domain has been on a downward trend, with periodicals and newspapers decreasing the most. However, in 2019, the rate of decline for these subdomains lessened, with periodicals down 4.0%, following an 8.6% drop in 2018, and newspapers down 3.6%, following a 8.5% decrease. This could indicate some stabilization within the publishing industries. Regionally, many provinces and territories recorded a similar trend.
Growth in sport GDP continues to outpace growth in culture GDP
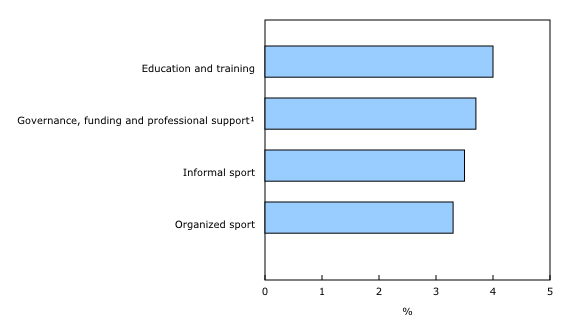
For the second consecutive year, growth in GDP attributable to sports (+3.7%) outperformed that of culture GDP (+2.5%). At the national level, every sport subdomain posted increases, most notably education and training (+4.0% or +$92.0 million) and organized sport (+3.3% or +$65.0 million).
Employment rises in Canada's culture and sport sectors
In 2019, employment rose 2.2% (or +16,597) in Canada's culture and sport sectors to just over 772,000 jobs. Culture jobs accounted for more than 80% of the increase (+13,395), led primarily by the visual and applied arts and audio-visual and interactive media domains, further highlighting the growing importance of digitization in the culture sector.
Regionally, culture jobs as a share of the total economy ranged from 1.8% in Nunavut to 4.2% in British Columbia. Overall, every province and territory posted job gains, except Newfoundland and Labrador, where the number of jobs edged down (-0.4%).
In parallel with sport GDP, sport employment increased in all subdomains in 2019. Altogether, employment in sport rose 3.3% and accounted for close to 99,000 jobs. Every province recorded a gain in total sport jobs, except Newfoundland and Labrador, where employment decreased slightly (-0.5%).
Note to readers
The Provincial and Territorial Culture Indicators (PTCI) were developed as an extension of the more comprehensive Provincial and Territorial Culture Satellite Account. The PTCI cover culture (including arts and heritage) and sport across Canada in terms of output, nominal gross domestic product (GDP), and jobs for the period from 2010 to 2019.
The PTCI are a joint initiative of Statistics Canada, other federal agencies, all provincial and territorial governments, as well as non-governmental organizations.
All the GDP figures in this release are expressed in nominal, basic prices. Total economy GDP is calculated using income-based GDP at market prices minus taxes less subsidies on products and imports.
This release focuses on the product perspective of the PTCI—the production of culture and sport goods and services and their contribution to output, GDP and jobs in both culture and non-culture industries and sport and non-sport industries.
Culture GDP is the economic value added associated with culture activities. This is the value added related to the production of culture goods and services across the economy, regardless of the producing industry. Culture jobs are the number of jobs that are related to the production of culture goods and services.
Sport GDP is the economic value added associated with sport activities. This is the value added related to the production of sport goods and services across the economy regardless of the producing industry. Sport jobs are the number of jobs that are related to the production of sport goods and services.
Film and video
The film and video subdomain underwent major enhancements starting with reference year 2015. The sources and methods for estimating this subdomain, notably the Survey of Service Industries: Film, Television and Video Production, have been revised to include improved estimation methods.
The new methodology increases the use of administrative data in combination with survey data to build the estimates. These methodological improvements were applied to all variables (GDP, output and jobs). As a result, the estimates for the film and video subdomain for 2015 going forward should not be compared with estimates for earlier periods.
Users should exercise caution with any aggregates that include the film and video subdomain, such as the audio-visual and interactive media domain and the total aggregate for culture. These aggregates also reflect the methodological improvements, and, depending on the economic importance of the film and video subdomain, could be significantly affected.
Written and published works
Print publishing has continued to decline as industries shift toward producing online content. This decline can be seen within the written and published works domain with the exception of the 2017 reference year. In 2017, the sources and methods for estimating this domain were enhanced to more accurately represent the presence of online publishers. This was a result of the new 2017 North American Industry Classification System.
Products
The Economic accounts statistics portal, accessible from the Subjects module of our website, features an up-to-date portrait of national and provincial economies and their structure.
The Latest Developments in the Canadian Economic Accounts (13-605-X) is available.
The User Guide: Canadian System of Macroeconomic Accounts (13-606-G) is available.
The Methodological Guide: Canadian System of Macroeconomic Accounts (13-607-X) is available.
Contact information
For more information, or to enquire about the concepts, methods or data quality of this release, contact us (toll-free 1-800-263-1136; 514-283-8300; STATCAN.infostats-infostats.STATCAN@canada.ca) or Media Relations (613-951-4636; STATCAN.mediahotline-ligneinfomedias.STATCAN@canada.ca).
- Date modified:


