Rail transportation, 2019
Archived Content
Information identified as archived is provided for reference, research or recordkeeping purposes. It is not subject to the Government of Canada Web Standards and has not been altered or updated since it was archived. Please "contact us" to request a format other than those available.
Released: 2021-04-08
Cold weather and a rail strike temper growth in freight volumes
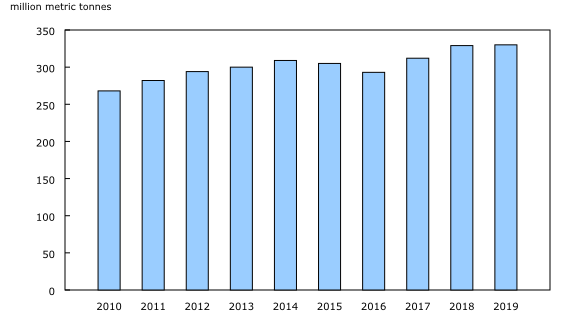
Freight tonnage edged up 0.5% from a year earlier to 330.2 million tonnes in 2019, despite two events disrupting rail transportation during 2019. An extreme bout of cold weather in February contributed to the lowest monthly volume carried in four years. In November, widespread volume declines across commodities coincided with a labour disruption in the Canadian rail industry that month.
Nevertheless, in December, significant volumes from the mining and quarrying as well as the oil and gas sectors helped to push overall tonnage up for another year. Canadian rail freight carriers have reported an 8.3% increase in freight tonnage since 2015, which has resulted in freight revenues growing 19.9% over the same period.
Operating expenses rise
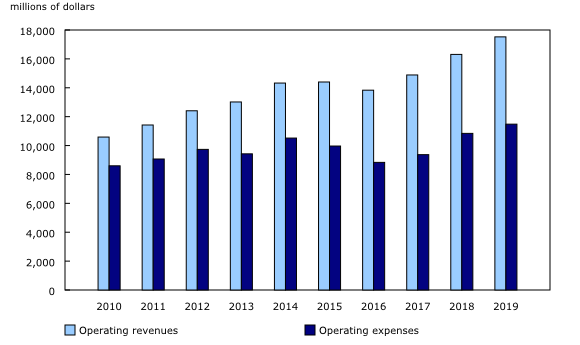
Railway operating expenses rose 5.9% from a year earlier to $11.5 billion in 2019. With the exception of diesel fuel, all other components of expenses increased, led by general administration costs, which includes wages and salaries (+10.7%), rail operations (+6.6%), equipment (+5.4%) and maintenance of way (+0.1%). Diesel fuel cost declined 4.7% as the cost of fuel per litre fell from $0.95 in 2018 to $0.87 in 2019.
Notwithstanding the growth in expenditures, the industry operating ratio (operating expenses expressed as a proportion of operating revenue) remained at 0.66 in 2019. In other words, railways incurred $66 of expenses to generate $100 in revenue during 2019.
Performance steady but labour productivity dips
The average haul of revenue freight—freight for which a charge is made—rose slightly to 1,260 kilometres in 2019. While the average number of cars per freight train edged up to 114, average train speed edged down to 37 kilometres per hour. Revenue tonne-kilometres—the movement of one tonne of revenue freight over one kilometre—edged up 0.7% in 2019.
Total employee compensation increased in 2019 as a result of more workers and higher wages. The number of employees rose 4.8% to 34,612 while average annual wages and related benefits edged up 0.1% to $98,284. Consequently, labour productivity - revenue tonne-kilometres per railway employee - declined 3.9% in 2019 to 13.0 million.
With railways hauling almost the same tonnage of freight in 2019 compared with a year earlier, diesel fuel consumed was relatively unchanged at 2.2 billion litres. However, the cost of diesel declined by 4.7% to $0.87 per litre in 2019, and brought overall fuel costs down to $1.9 billion.
Freight volumes driven by Western Canada
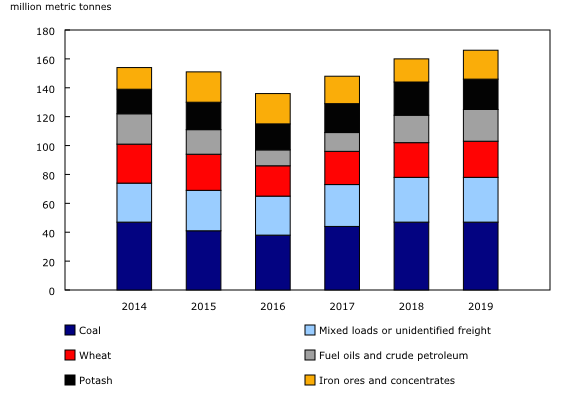
Railways transported 330.2 million tonnes of freight (intermodal and non-intermodal) in 2019, up 0.5% from 2018. Six commodities accounted for over half of this total. The largest year-over-year absolute increases were iron ores and concentrates (+3.4 million tonnes) and fuel oils and crude petroleum (+2.8 million tonnes).
More wheat (+0.9 million tonnes) and mixed loads or unidentified freight (+0.2 million tonnes) were transported while there was no change for coal and fewer tonnes of potash (-2.1 million tonnes) transported.
In 2019, 86.2% of all rail shipments by weight originated within Canada while 13.8% originated from the United States or Mexico. Just over two-thirds of all Canadian shipments originated from Alberta (26.9%), British Columbia (22.0%) and Saskatchewan (20.5%).
In Alberta, fuel oils and crude petroleum (23.9% of weight) was the leading commodity transported in 2019 with most (80.3%) destined for the United States. Wheat was next at 9.8% by weight, with almost all (98.5%) going to British Columbia for export.
Over the same period, coal (48.7%) remained the dominant commodity by weight transported by rail in British Columbia, with almost all (97.9%) moved within the province to export markets.
Of commodities transported by rail out of Saskatchewan, potash (34.8%) remained the largest with 47.1% shipped for export via British Columbia and 44.7% going to the United States or Mexico. Other key rail commodities originating from Saskatchewan were wheat (20.7%) and canola (9.7%), both transported to British Columbia for export.
Note to readers
This release is based on two data sources—an annual survey and a commodity origin and destination statistics administrative file from Transport Canada. The former collects financial as well as operating and employment data from a census of Canadian railways that provide for-hire freight and passenger services.
The commodity origin and destination statistics file measures the movements of commodities carried by Canadian National Railway (CN), Canadian Pacific Railway (CP), carriers that interline with CN and CP, as well as a number of regional and short-haul carriers that do not interline with either CN or CP.
Financial, operational and origin and destination data may change on a year-to-year basis as a result of fluctuations in currency exchange rates, reclassifications of accounts, etc. Data are also influenced by mergers, acquisitions and companies which may enter or exit the industry.
Data aggregations are available for Canada and select geographic regions.
It is important to note that the universe of regional and short-haul carriers changes regularly. In particular, in 2018, data from one company was added to the estimates for the first time. In previous years, this company was classified as inactive and no estimates were made. Therefore, any comparison of 2018 data with that of previous years should be made with caution, since this constitutes a break in the series.
Contact information
For more information, or to enquire about the concepts, methods or data quality of this release, contact us (toll-free 1-800-263-1136; 514-283-8300; STATCAN.infostats-infostats.STATCAN@canada.ca) or Media Relations (613-951-4636; STATCAN.mediahotline-ligneinfomedias.STATCAN@canada.ca).
- Date modified:


