Multinational enterprises exert a significant influence on the Canadian economy, 2018
Archived Content
Information identified as archived is provided for reference, research or recordkeeping purposes. It is not subject to the Government of Canada Web Standards and has not been altered or updated since it was archived. Please "contact us" to request a format other than those available.
Released: 2020-12-02
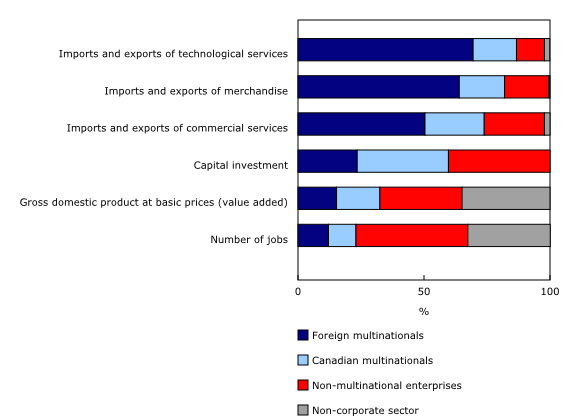
Despite being relatively few in number, multinational enterprises exert a significant influence on the Canadian economy. In 2018, multinational enterprises (MNEs) operating in Canada contributed to more than one-third of all jobs in the corporate sector, half of gross domestic product (GDP) and nearly 60% of all investment in the form of machinery and equipment, non-residential construction and intellectual property products.
The corporate sector accounted for more than two-fifths (43.5%) of the total 6.4 million enterprises in Canada in 2018. Since 2010, the earliest year for which data are available, MNEs have constituted approximately 1% of all enterprises in the corporate sector. The number of Canadian MNEs rose to 11,490 in 2018, while foreign MNEs edged down to 16,256.
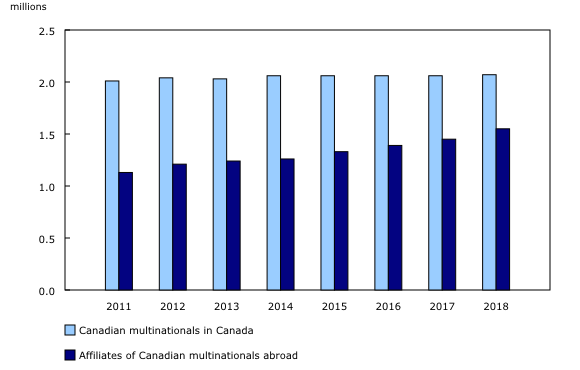
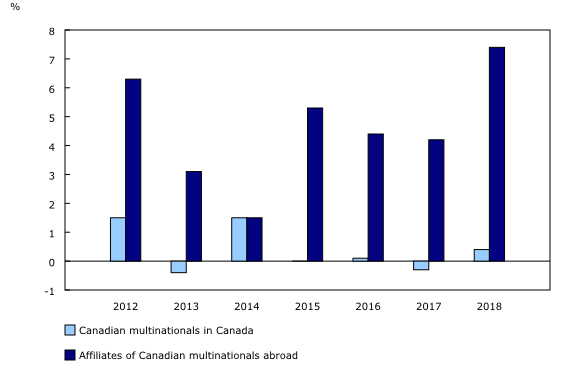
Canadian multinationals also have a significant presence in foreign markets. In 2018, the number of people employed by Canadian majority-owned affiliates abroad reached 1.6 million, a 7.4% increase from the previous year. This was largely attributable to merger and acquisition activities. In comparison, employment by Canadian MNEs in Canada posted an increase of 0.4%, reaching 2.1 million workers.
Overall, employment by Canadian MNEs totalled 3.6 million, with over two-fifths (42.9%) located abroad, a share that has been increasing since 2011 (36.1%).
Multinationals play a large role in Canada's trade in goods and services
Total Canadian international merchandise trade climbed by 7.0% to $1.1 trillion in 2018. Multinationals were responsible for nearly two-thirds of the increase. Similar to the previous year, foreign (64.0%) and Canadian (18.0%) multinationals together accounted for 82.0% of total merchandise exports and imports.
Compared to merchandise trade, MNEs represented a slightly lower but still substantial share of Canada's commercial services trade. Nearly three-quarters of all commercial services exports and imports were related to activities of multinationals in 2018.
The Canadian economy comprises the corporate sector (broken down between foreign MNEs, Canadian MNEs and non-MNEs in this release) and the non-corporate sector. The following analysis refers to the contribution of multinationals within the Canadian corporate sector only.
Foreign multinationals invest more on machinery and equipment, while Canadian multinationals spend more on non-residential construction
This release on Activities of Multinational Enterprises introduces a new indicator on capital investment, a measure of investment in the form of machinery and equipment, non-residential construction and intellectual property products. This information enables a better understanding of the role played by multinationals in investment in the country and sheds light on the extent of this activity that is under foreign control.
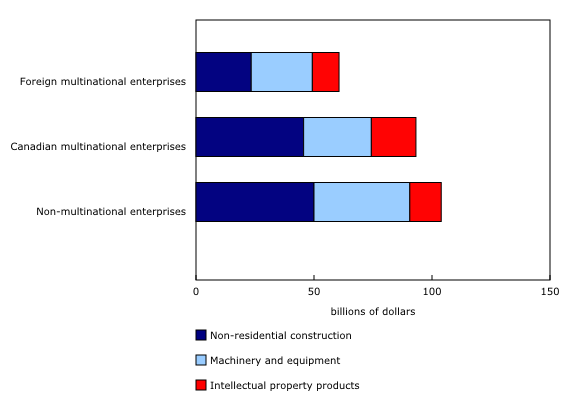
In 2018, corporate sector investment totalled $257.6 billion, up 7.3% from 2017. Canadian (36.2%) and foreign (23.5%) multinationals combined contributed more than non-multinationals (40.3%) to this activity.
Investment by multinationals and non-multinationals tend to be different in nature. Canadian (20.2%) and foreign (18.7%) multinationals both allocated a much higher share of their investment to intellectual property products than non-multinationals (12.8%) in 2018.
Canadian MNEs recorded their highest share of investment in non-residential construction (49.0%), while investment in machinery and equipment (42.7%) was the largest component for foreign multinationals. At the same time, foreign multinationals were responsible for more than 70% of all Canadian imports of machinery and equipment in 2018.
Capital investment under foreign control up in central provinces but down in Western provinces
In 2018, foreign MNEs operating in Canada invested $60.6 billion in machinery and equipment, non-residential construction and intellectual property products, with over half (51.0%) by affiliates ultimately controlled by the United States. The next highest source of this type of investment was from Canadian affiliates under European control ($14.7 billion), followed by affiliates controlled from Asia and Oceania ($11.7 billion).
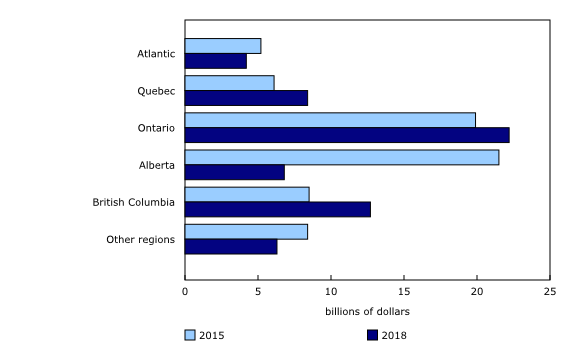
At the provincial level, more than one-third (36.6%) of all capital investment under foreign control came from establishments in Ontario in 2018, mainly in the manufacturing sector, a share that has been steadily increasing since 2016. In contrast, Alberta, the second largest province in terms of these investments (20.9%), saw its share declining from a high of 30.8% in 2015. A slowdown of activity in the mining, quarrying, and oil and gas extraction sector contributed the most to this downward trend.
Strong growth in employment at affiliates of Canadian multinationals abroad
From 2017 to 2018, employment by Canadian multinationals, both in Canada and through their majority-owned affiliates abroad, increased by 115,000 to 3.6 million. Of these jobs, 57.1% were in Canada, while the rest were located abroad.
Employment at Canadian majority-owned affiliates abroad was up for the seventh consecutive year and accounted for 93.2% of the worldwide increase by Canadian multinationals in 2018. Employment levels by affiliates abroad rose by 7.4%, whereas the growth for Canadian multinationals operating in Canada was 0.4%. Over half of all jobs added abroad were at affiliates located in the United States, which reported a 10.3% growth in 2018. In terms of employment growth, on average, affiliates abroad (+4.6%) have posted a much higher rate since 2011 than that of Canadian multinationals (+0.4%).
Overall for 2018, Canadian majority-owned affiliates abroad in the services sector added 62,700 jobs due to higher employment levels in the finance and insurance sector (+25,300), retail trade sector (+23,400), and the professional, scientific and technical services sector (+21,600). Meanwhile, affiliates abroad in the goods sector posted an increase of more than 44,100 jobs, led by manufacturing (+34,500).
For domestic employment by Canadian multinationals, the increase of 7,800 jobs in 2018 reflected growth in the finance and insurance (+52,300) and mining, quarrying, oil and gas extraction (+20,700) sectors, but was moderated by a decline in manufacturing (-30,000) and retail trade (-29,900).
Sales of Canadian multinationals up with faster growth from affiliates abroad
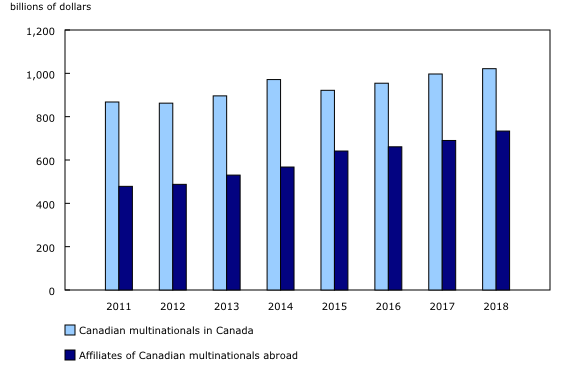
Worldwide sales of Canadian multinationals were up 4.0% to $1.8 trillion in 2018, with affiliates abroad responsible for nearly two-thirds of the increase.
Canadian majority-owned affiliates abroad generated $733.5 billion in sales in 2018, up 6.3% from a year ago. Nearly 70% of the increase was related to affiliates from the North America and Caribbean region, essentially the United States. Affiliates in the United States alone posted an increase of $29.5 billion. This increase can be attributed in part to a weaker Canadian dollar against the US dollar during this period.
On a sectoral basis, sales by affiliates of Canadian multinationals abroad in the goods-producing sector rose 10.3%, led by the manufacturing and mining and oil and gas extraction sectors. For the services-producing sector, sales by affiliates abroad increased by 2.9%, led by the retail trade sector.
Domestic operating revenue by Canadian multinationals grew at a slower pace, up by 2.5% to reach $1.0 trillion in 2018. Within Canada, the services sector led the increase in sales.
Note to readers
With this release, Statistics Canada has integrated analysis from both the Activities of Multinational Enterprises in Canada and Activities of Canadian Multinational Enterprises Abroad programs under the broad framework of multinational enterprises.
Activities of multinational enterprises in Canada cover foreign multinationals (firms in Canada controlled by a foreign parent) and Canadian multinationals (Canadian-controlled firms with a foreign affiliate).
Activities of Canadian multinational enterprises abroad cover affiliates abroad that are Canadian majority-owned. The figures represent the total sales, employment, and assets of those affiliates. These affiliates also include those who are ultimately controlled by foreign enterprises. As such, a slight share of worldwide activities of Canadian multinationals can be ultimately controlled from abroad, a common practice at the international level.
"Activities of Multinational Enterprises in Canada: Interactive Tool" has been developed to allow users to quickly, easily and efficiently browse these data.
Capital investment, alternatively called gross fixed capital formation (GFCF), uses microdata from multiple programs and benchmarks the data into a national accounting concept. Capital expenditure microdata from the Annual Capital Expenditure Survey (record number 2803) and intellectual property data related to research and development expenditure from the Supply, Use and Input Output program (record number 1401) are used as inputs. The microdata is then benchmarked, on an industry and provincial basis for each component of gross fixed capital formation (machinery and equipment, non-residential construction, and intellectual property products), to the values produced by the Industry Accounts Division on their supply and use tables (table 36-10-0478). For the most recent reference year, data were estimated based on all information available at the time of the release.
In this text, GFCF, capital investment and investment are used interchangeably. Canadian majority-owned affiliates abroad, Affiliates abroad and Affiliates of Canadian multinationals abroad are also used interchangeably.
The primary statistical unit used in the provincial level analysis is the establishment level. All other variables are presented at the enterprise level.
Products
The updated Canada and the World Statistics Hub (13-609-X) is available online. This product illustrates the nature and extent of Canada's economic and financial relationship with the world using interactive graphs and tables. This product provides easy access to information on trade, investment, employment, and travel between Canada and a number of countries, including the United States, the United Kingdom, Mexico, China, and Japan.
The Methodological Guide: Canadian System of Macroeconomic Accounts (13-607-X) is available.
The User Guide: Canadian System of Macroeconomic Accounts (13-606-G) is also available. This publication will be updated to maintain its relevance.
Contact information
For more information, or to enquire about the concepts, methods or data quality of this release, contact us (toll-free 1-800-263-1136; 514-283-8300; STATCAN.infostats-infostats.STATCAN@canada.ca) or Media Relations (613-951-4636; STATCAN.mediahotline-ligneinfomedias.STATCAN@canada.ca).
- Date modified:


