Survey of Postsecondary Faculty and Researchers, 2019
Archived Content
Information identified as archived is provided for reference, research or recordkeeping purposes. It is not subject to the Government of Canada Web Standards and has not been altered or updated since it was archived. Please "contact us" to request a format other than those available.
Released: 2020-09-22
First results from a new survey of postsecondary academic faculty and researchers show that one-third of survey participants from Canada's postsecondary sector identified as members of at least two diversity groups—with postdoctoral fellows and PhD student respondents most likely to identify with multiple groups.
The Survey of Postsecondary Faculty and Researchers was conducted in 2019 to fill data gaps on equity, diversity and inclusion among those who teach or conduct research in Canada's postsecondary sector. It also examines how various diversity characteristics, among survey respondents, have influenced their career experiences. The survey was sponsored by Innovation, Science and Economic Development Canada.
The survey results are representative of the survey participants, of which approximately half were university faculty (49%), one-third college faculty (29%) and one-fifth doctoral students (18%). The remaining 4% were postdoctoral fellows.
One-third of academic faculty and researchers identify with at least two diversity groups
When assessing diversity based on gender, belonging to a group designated as a visible minority, Indigenous identity, self-reported disability, sexual orientation and the first official language spoken, survey results demonstrate that the academic community is relatively diverse. On average, 31% of survey participants have identified with at least two of these diversity groups.
Postdoctoral fellows and PhD student respondents were most likely to identify with multiple diversity groups. About 33% of postdoctoral fellows and 43% of PhD students identified with at least two diversity groups, compared with 28% of both college and university faculty. More than twice as many PhD students (9%) identified with three to five diversity groups, compared with 4% of university faculty and postdoctoral fellows, and 3% of college faculty.
Postdoctoral fellows and PhD students are younger and more diverse
In general, younger faculty and researchers were more diverse: 39% of respondents below age 35 identified with two or more diversity groups, compared with 29% of those 35 years and older. The majority of postdoctoral fellows (55%) and PhD students (63%) in the survey were under 35 years old, compared with 9% of the college faculty and 11% of the university faculty.
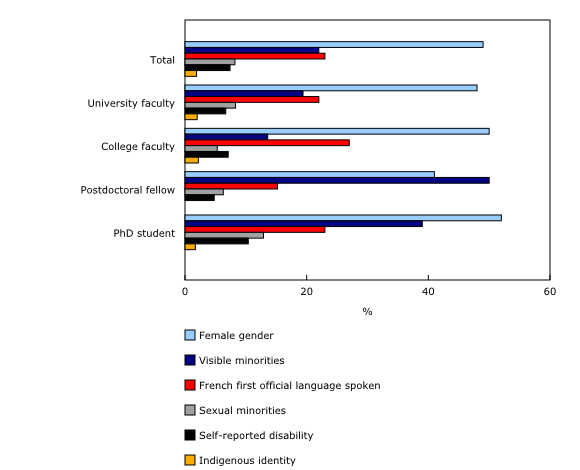
Just over one-fifth of faculty and researchers belonged to groups designated as visible minorities—in line with the Canadian population overall, according to the 2016 Census (22%). Postdoctoral fellows (50%) and PhD students (39%) were most likely to report belonging to groups designated as visible minorities.
The top two groups designated as visible minorities reported in the survey were from China and India, which combined accounted for 41% of the faculty and researchers belonging to a visible minority group. This is consistent with the growing enrolment of international students in Canadian postsecondary institutions, especially from China and India, which together account for the majority (51%) of international students in Canada.
While postdoctoral fellows were less likely to have French as a first official language, the linguistic profile of the academic community in general reflected that of the Canadian population, with 23% of survey respondents reporting French as the first official language spoken, compared with 23% of the population in Canada. French was more commonly the first official language spoken among the academic community in Quebec (74% compared with 6% for the rest of Canada) and among college faculty (27% compared with 22% for university faculty).
Among survey respondents, 8% self-identified as gay, lesbian, bisexual, pansexual or as another sexual minority. The highest share was among doctoral students (13%) and university faculty (8%) and the lowest among college faculty (5%).
Fewer than 1 in 10 respondents (7%) self-reported having a disability or a physical or mental impairment that creates functional limitations or may produce disadvantages in their employment. Doctoral students (10%) were most likely to self-report a disability. It should be noted, however, that self-reporting yields an underestimation of some disability types when compared with rates from other surveys, such as the Canadian Survey on Disability, which uses the disability screening questions.
Colleges have a higher proportion of First Nations, Métis and Inuit faculty and researchers
First Nations, Métis and Inuit faculty and researchers accounted for 1.9% of academic community respondents. This is comparable with the share of university and college professors who reported an Indigenous identity in the 2016 Census: 1.4% of university and 3.0% of college professors. While the educational attainment of Indigenous people has been increasing, they are still less likely to have a degree at the bachelor's level than non-Indigenous Canadians. The highest share of Indigenous survey respondents was among college professors (2.2%).
Highest gender parity among university and college faculty
Among survey respondents, there was an equal share of male and female respondents for university faculty (51% male and 48% female) and college faculty (50% of both). This is consistent with trends observed in other studies that show the representation of women among university faculty has increased markedly over the last 50 years.
Women accounted for a slightly higher share of doctoral students (52% compared with 47% of men) while the majority of postdoctoral fellows were men (58% compared with 41% of women). The highest proportion of gender-diverse respondents was among postdoctoral fellows (1.2%) and PhD students (0.7%), while the share stood at 0.2% for both university and college faculty.
Women are more likely than men to report unfair treatment or discrimination
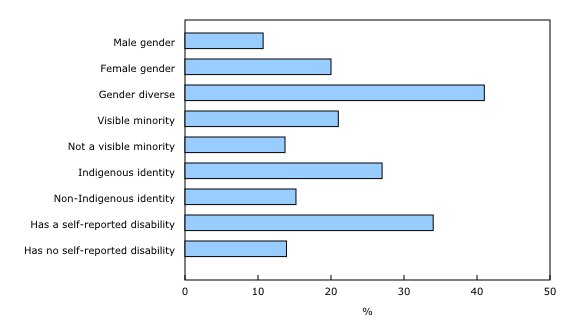
Among postsecondary faculty and researcher respondents, women and men were equally likely to identify with multiple diversity groups. However, men were less likely to report experiencing unfair treatment or discrimination in the year preceding the survey due to at least one diversity characteristic (age, sex, religion, race, sexual orientation, language, gender identity, physical or mental disability). For example, just over 1 in 10 men (11%) experienced unfair treatment or discrimination, compared with 20% of women and 41% of respondents who self-identified as being gender diverse.
Among survey respondents, individuals that identified as belonging to groups designated as a visible minority (21%), reported an Indigenous identity (27%), or who self-reported as having a disability (34%) were more likely than their counterparts to have reported experiencing unfair treatment or discrimination in the year preceding the survey.
Tenured faculty at universities tend to be less diverse and more likely to be male
After being hired on a tenure-track position, university faculty work toward achieving tenured status at their institution. According to the survey, 37% of university faculty were tenured, and another 8% were working in positions leading to tenure. On average, survey respondents took 6.2 years to achieve tenure.
The composition of tenured faculty at universities tends to be less diverse and more predominantly male due to the permanence of these positions and the small changes in the size of this group. Among survey respondents, differences in tenure were particularly marked among the Indigenous faculty, where 21% were tenured, compared with 37% of non-Indigenous faculty; and for female faculty, where 31% were tenured compared with 43% of males.
Men are more likely to receive research funding than women
According to data from the latest Financial Information on Universities survey, 19% or $7.6 billion of total university revenues were exclusively reserved for research in 2017/2018. Research funding is an important resource for university faculty since it allows them to support graduate students, pay for additional research staff and purchase equipment and supplies required for research.
About half (46%) of permanent university faculty in the survey reported having received research funding from any source, compared with 1 in 10 contract faculty. Among permanent faculty, 23% received funding from both federal and non-federal sources, whereas 13% received only federal research funding, and 10% received only non-federal research funding.
Men were more likely to receive research funding (44%) than women (40%), as were faculty belonging to a visible minority group (44% versus 41% of those who did not). Respondents with a self-reported disability were less likely to receive funding (38%) than faculty with no self-reported disability (42%), as were those reporting an Indigenous identity (37% versus 42% on non-Indigenous faculty).
Note to readers
The Survey of Postsecondary Faculty and Researchers aims to fill data gaps on equity, diversity, and inclusion among those who teach or conduct research in Canada's postsecondary sector, including full- and part-time university faculty, college instructors, postdoctoral fellows and doctoral students. It provides estimates of how various diversity characteristics—such as gender, visible minority status, Indigenous identity, self-reported disability, sexual orientation, use of official languages and others—may influence career experiences and affect career advancement of the survey respondents in the Canadian academic community.
In the absence of a complete survey frame that lists all post-secondary institutions, faculty and researchers, several files were combined—including tax data, census, Postsecondary Student Information System, immigration, and research funding data sets—to create a survey frame. The survey population was selected from this survey frame.
Survey weights were adjusted to account for non-respondents, but were not further calibrated due to the unavailability of external control totals that were aligned with the coverage of the survey population. As a result, the survey results are only representative of the surveyed population, not necessarily the targeted population. Due to the methodology used, survey results cannot be released for individual post-secondary institutions.
Indigenous population includes persons who identified as Aboriginal, that is, First Nations (North American Indian), Métis or Inuk (Inuit).
Non-Indigenous population includes persons who did not identify as Aboriginal, that is, First Nations (North American Indian), Métis or Inuk (Inuit).
Contact information
For more information, or to enquire about the concepts, methods or data quality of this release, contact us (toll-free 1-800-263-1136; 514-283-8300; STATCAN.infostats-infostats.STATCAN@canada.ca) or Media Relations (613-951-4636; STATCAN.mediahotline-ligneinfomedias.STATCAN@canada.ca).
- Date modified:


