Monthly civil aviation statistics, May 2020
Archived Content
Information identified as archived is provided for reference, research or recordkeeping purposes. It is not subject to the Government of Canada Web Standards and has not been altered or updated since it was archived. Please "contact us" to request a format other than those available.
Released: 2020-07-30
Highlights
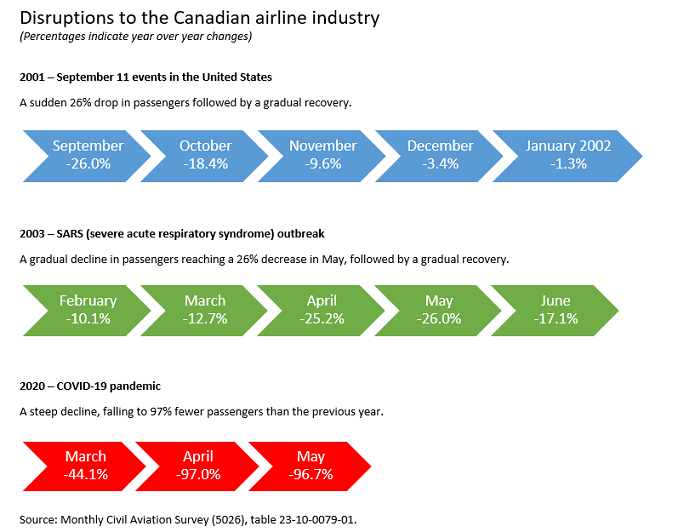
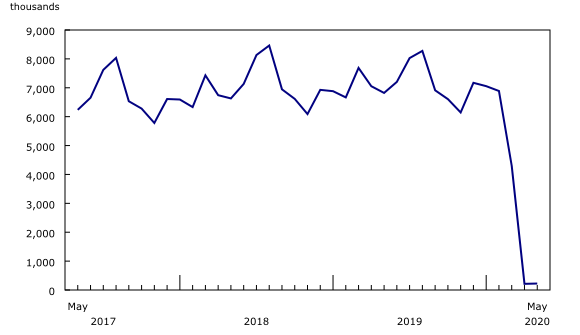
Major Canadian airlines carried 224,000 passengers on scheduled and charter services in May, down 96.7% from the same month in 2019. This follows the unprecedented decline of 97.0% observed in April 2020.
As a result, air traffic plunged to 457.2 million passenger-kilometres, pushing operating revenues down 89.2% to $217.3 million in May, a mild uptick from the 92.9% decline recorded in April 2020.
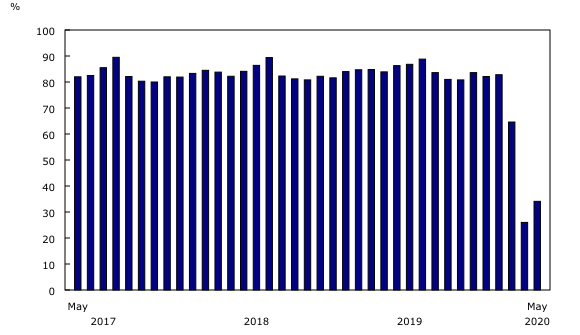
Passenger load factor—the ratio of passenger-kilometres to available seat-kilometres—which has remained near or above 80% since 2015, plunged in March (64.6%), April (26.0%) and May (34.1%) 2020.
Canada's airline industry faces an unprecedented challenge as the impacts of the COVID-19 pandemic continue to be felt. Because of travel restrictions and border closures, many Canadian carriers operated minimal passenger flights, while others suspended all their operations in April, May and into the summer. The crisis reached its nadir in April and May, as international air travel almost entirely stopped in Canada and across the globe.
Challenging times as the pandemic hits airline industry hard
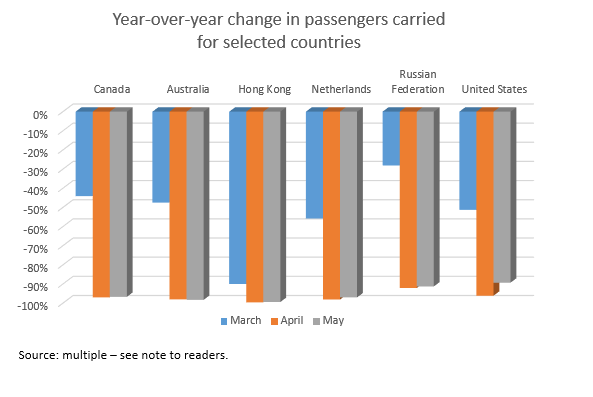
The COVID-19 pandemic continues to have devastating impacts on the airline industry in Canada and around the world. Despite early signs of recovery in domestic markets in May, the International Air Transport Association (IATA) points to an uncertain outlook for the coming months, as consumers remain reluctant to travel. Border restrictions and mandatory quarantines for international travellers in many countries mean that global international air traffic has dwindled to a trickle, 98% to 99% lower than last year according to IATA.
In Canada, some airlines have announced the permanent or indefinite suspension of certain routes, closures of operations at some airports, and permanent layoffs in addition to temporary measures. As of July 1, some airlines resumed the sale of adjacent seats, but protective face coverings remained mandatory for all passengers and crew.
Passenger demand remains at a standstill in May
The seven Canadian Level I air carriers flew 224,000 passengers on scheduled and charter services in May, down 96.7% from the same month in 2019, when there were six carriers. This follows a similar (-97.0%) decline in April, when 213,000 passengers travelled on board major carriers' flights. May marks the third consecutive year-over-year monthly decline, all three sharper than any previous decreases recorded in the Monthly civil aviation statistics.
Operating revenue for these airlines totalled $217.3 million in May, down 89.2% from the same month a year earlier, when total operating revenue was $2.0 billion.
Traffic fell 97.4% year-over-year to 457.2 million passenger-kilometres in May, while capacity contracted 93.7% to 1.3 billion available seat-kilometres—the largest year-over-year monthly decline in capacity ever recorded. As a result, May's passenger load factor dropped to 34.1%—significantly lower than in May 2019 (83.9%), but a slight improvement from April 2020 (26.0%). With far fewer international flights available, each passenger travelled an average of 2,038 kilometres in May, down 22.3% from May 2019.
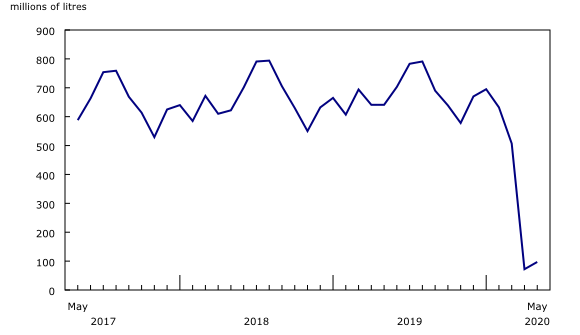
The volume of turbo fuel consumed declined 84.8% to 97.4 million litres. The number of flying hours fell 92.7% to 13,000 hours. This exceeds the 90.7% decrease registered in April and represents another historic drop in the series.
COVID-19 brings historic declines
In May 2003, the month with the largest declines during the SARS outbreak, the number of passengers decreased 26.0%, and the number of flying hours decreased 22.1% compared with May 2002. That year saw a gradual decline, culminating in May, followed by a gradual recovery. In contrast, COVID-19 brought about a sudden and steep decline, reducing air passengers in the months of April and May to a level not seen in decades.
Note to readers
The Monthly Civil Aviation Survey covers all Canadian Level I air carriers: Air Canada (including Air Canada Rouge), Air Transat, Jazz, Porter, Sky Regional, Sunwing and WestJet (including Swoop, WestJet Encore and WestJet Link).
The number of air carriers increased from six in 2019 to seven in 2020, as one Level II air carrier was reclassified to Level I.
The average passenger trip length is obtained by dividing the number of passenger-kilometres by the number of passengers. Trips across Canada and across the globe are included in this calculation.
Data in this monthly release are not seasonally adjusted.
The information presented in Infographic 1 was pulled from several sources:
Canada: Monthly Civil Aviation Survey (5026).
Australia: Bureau of Infrastructure, Transport and Regional Economics (BITRE), International Airline Activity—Monthly Publications, International Airlines - International traffic to/from Australia, June 12, 2020, and July 14, 2020.
Hong Kong: Cathay Pacific Group (Cathay Pacific and Cathay Dragon) Combined Traffic Figures for March, April and May 2020, April 16, 2020, May 15, 2020, and June 12, 2020.
Netherlands: Eurostat, Air passenger transport by reporting country.
Russian Federation: Federal State Statistic Service, Main indicators of carrying activity of transport, Passengers carried by mode of transport; Federal Air Transport Agency, Statistical data, Main performance indicators for civil aviation.
United States: Bureau of Transportation Statistics (BTS), T-100 Market and Segment, March and April 2020 and BTS 45-20, Preliminary Air Traffic Data, May 2020.
Contact information
For more information, or to enquire about the concepts, methods or data quality of this release, contact us (toll-free 1-800-263-1136; 514-283-8300; STATCAN.infostats-infostats.STATCAN@canada.ca) or Media Relations (613-951-4636; STATCAN.mediahotline-ligneinfomedias.STATCAN@canada.ca).
- Date modified:


