Aircraft movement statistics: Major airports, February 2020
Archived Content
Information identified as archived is provided for reference, research or recordkeeping purposes. It is not subject to the Government of Canada Web Standards and has not been altered or updated since it was archived. Please "contact us" to request a format other than those available.
Released: 2020-04-29
406,940
February 2020
+15.3% 
(year-over-year change)
As a result of the COVID-19 outbreak, the Canadian government restricted flights between Canada and China in late January. In February, traffic between the two countries dropped by 49.8%, to 385 takeoffs and landings from 767 in February 2019. Flights between China and Toronto/Lester B. Pearson International, Ontario were down 56.4% while those between China and Vancouver International, British Columbia were down 41.8%.
It is expected that larger impacts on aircraft movements will be felt in March. Early in the month, Air Canada cancelled flights between Toronto and Hong Kong and to Italy. By month's end, Canadian carriers had gradually suspended most transborder and other international routes in response to further travel restrictions put in place by the Government of Canada.
Last year, March was the busiest month of the year for flights between Canada and other international destinations, and the fifth busiest month of the year for transborder flights. With travel in both segments restricted this year, March will see a more severe reduction in air traffic with significant declines across all sectors in the months that follow.
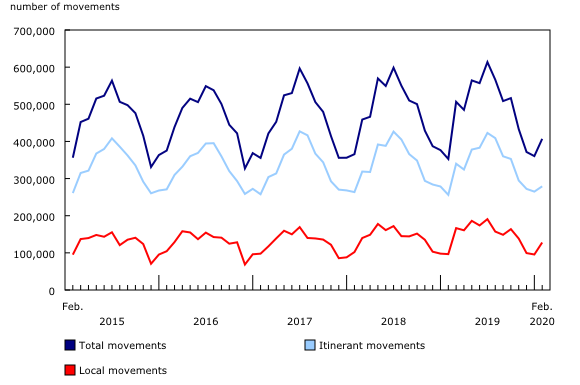
Meanwhile, February data show aircraft take-offs and landings increased 15.3% to 406,940 movements, compared with 352,797 in February 2019, at the 90 Canadian airports with NAV CANADA air traffic control towers and flight service stations. It should be noted that February 2020 had 29 days, while February 2019 had 28 days.
Itinerant movements (flights from one airport to another) grew 8.9% to 279,079 and local movements (flights that remain in the vicinity of the airport) were up 32.4% to 127,861. Each was impacted by increased activity by general aviation operations.
Overall itinerant growth was largely attributable to a rise in the domestic sector with domestic itinerant movements (within Canada) increasing by 11.0% to 227,592. By comparison, transborder movements (between Canada and the United States) increased marginally, by 0.6% to 35,013, as did other international traffic (+0.5% to 16,474 movements). Indeed, excluding activity on February 29, 2020, both transborder and other international movements would have declined.
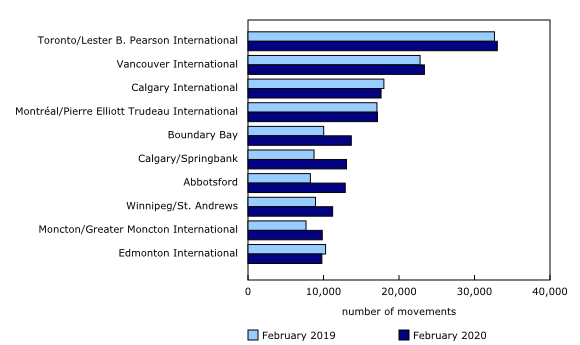
In February, the 10 busiest airports accounted for almost 4 out of every 10 (39.7%) movements. Toronto/Lester B. Pearson International is Canada's busiest airport and reported 33,017 movements (+1.1%). This was followed by Vancouver International, which reported 23,364 movements (+2.5%); Calgary International, Alberta, with 17,626 movements (-2.1%); and Montréal/Pierre Elliott Trudeau International, Quebec, with 17,148 movements (+0.4%).
Note to readers
This survey collects data on itinerant and local aircraft movements at major airports in Canada.
Major airports include all airports with either a NAV CANADA air traffic control tower or a NAV CANADA flight service station.
On January 30, 2020, a NAV CANADA Air Traffic Control (ATC) Service was re-established at Montréal/Mirabel International Airport, Quebec for 16 hours per day. In 2008, due to a reduction in traffic levels, ATC service at the airport was replaced by a flight service station. As a result, effective February 1, 2020, monthly aircraft movement data for the airport will revert back to tables 23-10-0002-01 through 23-10-0008-01 (airports with NAV CANADA towers). Data from December 2008 to January 2020 continue to be available in tables 23-10-0009 through 23-10-0015-01 (airports with NAV CANADA flight service stations).
An aircraft movement is defined as a take-off, a landing or a simulated approach by an aircraft as defined by NAV CANADA.
Data for the same month in the previous year may have been revised.
The data in this monthly release are not seasonally adjusted.
Contact information
For more information, or to enquire about the concepts, methods or data quality of this release, contact us (toll-free 1-800-263-1136; 514-283-8300; STATCAN.infostats-infostats.STATCAN@canada.ca) or Media Relations (613-951-4636; STATCAN.mediahotline-ligneinfomedias.STATCAN@canada.ca).
- Date modified:


