Innovation in the food processing industry, 2018
Archived Content
Information identified as archived is provided for reference, research or recordkeeping purposes. It is not subject to the Government of Canada Web Standards and has not been altered or updated since it was archived. Please "contact us" to request a format other than those available.
Released: 2019-12-12
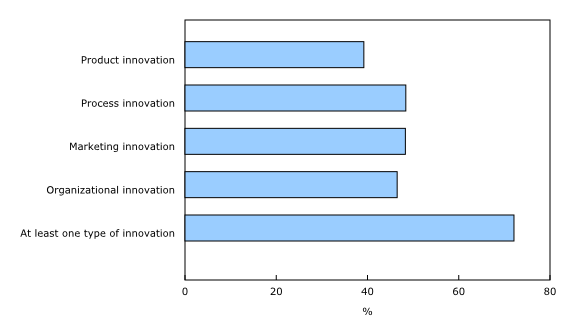
With sales totalling over $100 billion a year, food processing is the second largest sector in Canada's manufacturing industry, following transportation equipment. It is also highly innovative, with almost three-quarters of firms in the food processing industry (72%) introducing at least one of four types of product, process, organizational or marketing innovation during the fiscal years 2016 to 2018. Nearly half (48%) introduced new methods in their processing operations and 39% made a new or improved product available on the market.
Organizational innovations such as the implementation of new methods in business practices, workspace organization or external relations with other organizations were introduced by 47% of firms in the food processing industry. Almost half introduced some type of marketing innovation (48%) such as the use of new media or new promotion techniques, new product placement or pricing methods, and changes to aesthetic design or packaging.
Innovation in the food processing industry occurs across Canada. Product innovation was highest in British Columbia and the territories (Yukon, the Northwest Territories and Nunavut) (44%) followed by Ontario (43%) and Quebec (42%). Ontario led the way in process innovation at 51%, followed closely by Quebec (49%) and British Columbia and the territories (48%).
Firms in Alberta were most likely to introduce marketing innovation (54%), followed by British Columbia and the territories and Quebec (both at 51%). British Columbia and the territories had the highest rate of organizational innovation (50%), trailed closely by Ontario (49%) and Quebec (48%).
While the Atlantic provinces had the lowest proportion of innovation for all four types, over half of the food processing firms in Newfoundland and Labrador, Prince Edward Island, Nova Scotia and New Brunswick were engaged in some type of innovation. Firms in British Columbia and the territories were the most innovative (76%), while those in Manitoba and Saskatchewan were in the middle of the pack (69%).
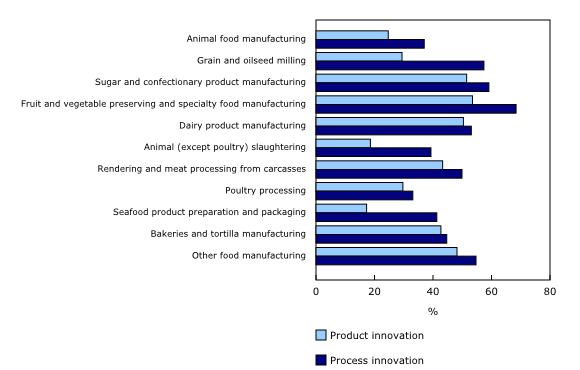
Among the food processing sub-industries, firms in fruit and vegetable preserving and specialty food manufacturing were most likely to have introduced product innovation (54%) and process innovation (68%), followed by firms in sugar and confectionary product manufacturing, where 52% introduced product innovation and 59% introduced process innovation.
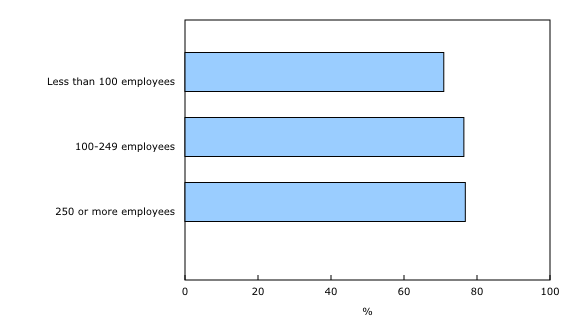
The likelihood of introducing any type of innovation increased with the size of a firm's workforce. Just over three-quarters (77%) of large firms (250 or more employees), 76% of medium firms (100 to 249 employees), and 71% of small firms (less than 100 employees) introduced at least one type of innovation.
When food processing industry firms were asked how they currently measure and record quantities of inedible food parts and unmarketable food products, 54% reported some type of record keeping. Of those that could trace their food loss, 36% kept records of disposal costs, 23% logged quantities sold or donated to third parties, and 22% recorded quantities used for re-processing.
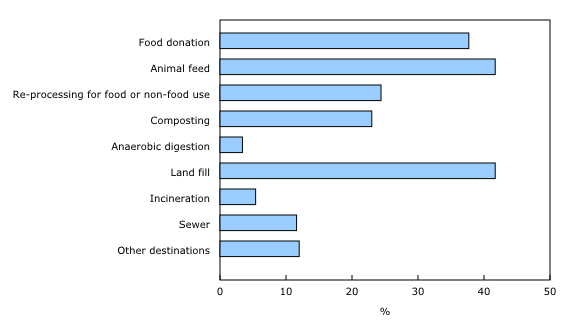
Of the firms that reported unmarketable food products or inedible food parts, many used a combination of removal methods, including redirecting to produce animal feed (42%), sending to landfills (42%), food donation (38%), re-processing for food or non-food use (24%), as well as composting (23%).
Note to readers
The innovation in the food processing industry 2018 survey was conducted on behalf of Agriculture and Agri-Food Canada. The survey covered 2,217 sampled firms. The target population consisted of firms classified to NAICS 311 - Food Manufacturing with at least one employee and one million dollars in revenue. Data pertaining to the type of innovation, number of products and processes, methods, objectives, obstacles, environmental benefits, government support programs, R&D and capital related to food processing innovation were collected, as well as measures for inedible food parts and unmarketable food products and private certification systems.
Definitions
Inedible food parts include ingredients that were unfit for processing and ingredients/finished products that were spoiled or spilled during production, distribution, handling and storage (excluding feed).
Examples include: bruised fruits; spoiled meat; partly processed food ingredients discarded due to machinery breakdown, maintenance or cleaning; formula changes for multiple products such as dough mixes and soups, and ingredients/products that do not meet food safety requirements.
Unmarketable food products are perfectly edible food products that businesses were not able to sell for human consumption for various reasons, including:
- Food products that did not meet the quality standards (for example, incorrect weight, freshness, size, ingredient proportion);
- Packaging or labelling errors;
- Surplus food products that exceeded the market demand (for example, could not find a buyer).
Contact information
For more information, or to enquire about the concepts, methods or data quality of this release, contact us (toll-free 1-800-263-1136; 514-283-8300; STATCAN.infostats-infostats.STATCAN@canada.ca) or Media Relations (613-951-4636; STATCAN.mediahotline-ligneinfomedias.STATCAN@canada.ca).
- Date modified:


