Farm cash receipts, January to September 2019
Archived Content
Information identified as archived is provided for reference, research or recordkeeping purposes. It is not subject to the Government of Canada Web Standards and has not been altered or updated since it was archived. Please "contact us" to request a format other than those available.
Released: 2019-11-26
$47.4 billion
January to September 2019
4.5% 
(year-over-year change)
Farm cash receipts increase during the first three quarters of 2019
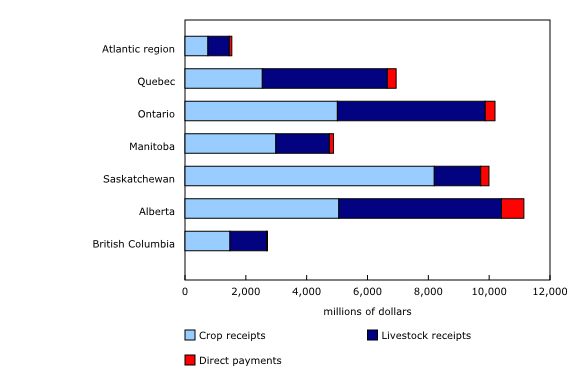
Farm cash receipts for Canadian farmers totalled $47.4 billion (correction) in the first three quarters of 2019, up 4.5% (correction) from the same period in 2018. Receipts were up in every province except Saskatchewan (-2.4%) and Manitoba (-1.5%) (correction).
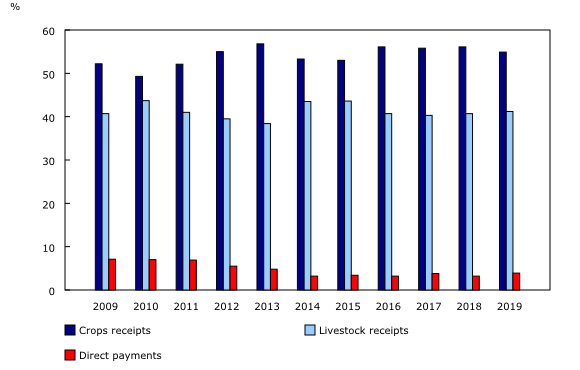
All three components of farm cash receipts were up on a year-over-year basis: livestock (up $1.0 billion to $19.5 billion), crops (up $602.3 million [correction] to $26.0 billion) and total direct payments (up $398.1 million to $1.9 billion).
Higher livestock receipts mostly attributable to cattle, hogs and dairy
Livestock cash receipts rose 5.7% to $19.5 billion over the first three quarters of 2019 as a result of gains in cattle (up $342.3 million), hogs (up $336.1 million) and dairy (up $276.6 million) receipts. Livestock receipts were up in six provinces, ranging from a 2.4% increase in Prince Edward Island to a 10.2% gain in Alberta.
The 5.6% increase in cattle receipts was attributable to higher slaughter receipts (+5.2%) and international exports of live animals (+24.3%), which rose because of increased marketings. This increase was concentrated in Alberta.
Higher slaughter (+9.3%) and export (+11.6%) prices pushed hog receipts up 10.9% from January to September 2019, compared with the same period a year earlier.
Farm cash receipts for supply-managed industries (which accounted for 43.5% of livestock receipts) increased by 5.0% to $8.5 billion in the first three quarters of 2019 as a result of dairy (+5.6%)—on higher prices (+6.2%)—and chickens for meat (+4.3%) and eggs (+6.5%), on higher prices and marketings.
Crop receipts: A mixed story
Crop receipts rose 2.4% year over year (correction) to $26.0 billion during the first three quarters of 2019. Without cannabis, which was legalized for recreational use in October 2018, crop receipts would have fallen by 2.0% (correction).
Canola receipts were down 12.1% in the first three quarters of 2019, mostly because of lower prices (-10.1%) and marketings (-2.2%) in the wake of import restrictions imposed by China. In 2019, China's share of canola exports fell from 50% to 20% year over year. Higher farm inventories and domestic crushing accounted for the smaller decline in marketings. Soybean receipts decreased 14.4% (correction), mainly because of lower marketings (-9.8%) (correction) as a result of the global oversupply of oilseeds. Wheat receipts (excluding durum) were down 5.0%. These three crops alone accounted for 42.5% (correction) of total crop receipts.
Smaller gains were reported for lentils and maple products. Because of increased demand from India, lentil marketings and prices were up, compared with 2018 levels. Preliminary estimates for maple products suggest that the 2019 yields were up from a year earlier.
Large crop insurance payments to Alberta and Ontario
Total direct payments increased by 27.2% to $1.9 billion, with seven provinces reporting higher payments. Crop insurance was the biggest component of direct payments, with the largest increases in Alberta (up $282.9 million) and Ontario (up $114.2 million). This was mainly because of adverse weather conditions during the 2018 crop harvest in Alberta and the 2019 crop planting in Ontario.
Note to readers
All data in this release are in current dollars. Farm cash receipts measure the gross revenue of farm businesses. They include sales of crops and livestock products (except sales between farms in the same province) and program payments. Receipts are recorded when the money is paid to farmers. These do not represent their bottom line, as farmers have to pay their expenses and loans and cover depreciation.
Farm cash receipts are, for the most part, based on monthly marketings and the monthly prices of various commodities. Marketings are quantities sold, using various units of measure.
Data are extracted from administrative files and derived from other Statistics Canada surveys and/or other sources. These data are subject to revision.
For details on farm cash receipts and net farm income for 2018, see the "Farm income" release in today's Daily.
Contact information
For more information, or to enquire about the concepts, methods or data quality of this release, contact us (toll-free 1-800-263-1136; 514-283-8300; STATCAN.infostats-infostats.STATCAN@canada.ca) or Media Relations (613-951-4636; STATCAN.mediahotline-ligneinfomedias.STATCAN@canada.ca).
- Date modified:


