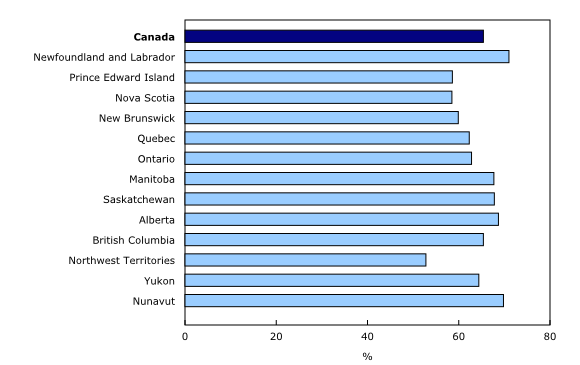
Remaining useful service life ratios of non-residential capital stock, 2017
Archived Content
Information identified as archived is provided for reference, research or recordkeeping purposes. It is not subject to the Government of Canada Web Standards and has not been altered or updated since it was archived. Please "contact us" to request a format other than those available.
Released: 2019-11-19
In 2017, because of changes in investment patterns, the share of Canadian non-residential capital stock's remaining useful service life edged down 0.3 percentage points to 65.4%—its lowest level since 2012.
A significant share of new investments were made in assets with shorter service lives. For instance, investment in transportation equipment—which has a relatively shorter useful life than, for example, industrial buildings—was up 60.9% in 2017.
In 2017, three of the four broad asset categories that comprise Canadian non-residential capital stock posted decreases in their shares of remaining useful service life. Intellectual property products declined for the ninth straight year to 60.2% (-1.3 percentage points from 2016), non-residential engineering capital stock declined to 69.1% (-0.5 percentage points), and non-residential buildings decreased by 0.2 percentage points to 62.7%. Only the share of remaining useful service life for machinery and equipment increased—up 0.1 percentage points to 55.3%.
In 2017, as was the case in the four previous years, non-residential assets in both the government sector (66.3%) and the non-profit institutions serving household sector (67.5%) posted decreases in their shares of remaining useful service life.
Within the business sector, the largest declines were seen in shares for health care and social assistance (-1.4 percentage points), and mining, quarrying, and oil and gas extraction (-1.3 percentage points). Information and cultural industries posted the largest increase (+1.3 percentage points).
Seven provinces and territories saw decreased ratios
In 2017, the ratio of remaining useful service life for non-residential capital stock decreased in the majority of the provinces and territories. This ratio ranged from a low of 52.8% in the Northwest Territories to a high of 71.0% in Newfoundland and Labrador.
This was the second time that Newfoundland and Labrador held the highest share of remaining useful service life in Canada, surpassing Nunavut in 2016. The increase of 0.1 percentage points in Newfoundland and Labrador was mainly the result of the recent investment in the Muskrat Falls generating facility.
In 2017, Alberta (68.7%) posted its third consecutive annual decrease—down 1.0 percentage point. This was the largest decrease among the provinces and territories, and was spread across all four broad asset categories.
The slowdown in investment in the oil and gas subsector continued to weigh on Saskatchewan's share of remaining useful life (67.8%), down 0.7 percentage points in 2017.
In 2017, remaining useful service life ratios remained relatively unchanged in Ontario (62.8%) and Quebec (62.3%). In both provinces, decreases in the shares for non-residential buildings, non-residential engineering, and intellectual property products were offset by increases in machinery and equipment.
The Northwest Territories, Nova Scotia, Prince Edward Island and New Brunswick had the lowest remaining useful service life ratios in Canada in 2017, unchanged from the preceding four years.
Note to readers
The share of an asset's remaining useful life is an estimate of the percentage of its remaining useful life before it no longer delivers an economic benefit to its owner. For example, if the expected useful life of an asset is 20 years and the average remaining life of the asset is 15 years, then the share of the remaining useful life would be 75%.
Because of the weighted nature of the calculation, a higher proportion of investment spending in recent periods on a given non-residential asset relative to previous periods will result in a younger average investment age and, consequently, a higher remaining useful service life.
Products
The data visualization product "Infrastructure Statistics Hub," which is part of Statistics Canada – Data Visualization Products (71-607-X), is available.
The Latest Developments in the Canadian Economic Accounts (13-605-X) is available.
The User Guide: Canadian System of Macroeconomic Accounts (13-606-G) is available.
The Methodological Guide: Canadian System of Macroeconomic Accounts (13-607-X) is also available.
Contact information
For more information, or to enquire about the concepts, methods or data quality of this release, contact us (toll-free 1-800-263-1136; 514-283-8300; STATCAN.infostats-infostats.STATCAN@canada.ca) or Media Relations (613-951-4636; STATCAN.mediahotline-ligneinfomedias.STATCAN@canada.ca).
- Date modified:


