Quarterly civil aviation statistics, first quarter 2019
Archived Content
Information identified as archived is provided for reference, research or recordkeeping purposes. It is not subject to the Government of Canada Web Standards and has not been altered or updated since it was archived. Please "contact us" to request a format other than those available.
Released: 2019-09-09
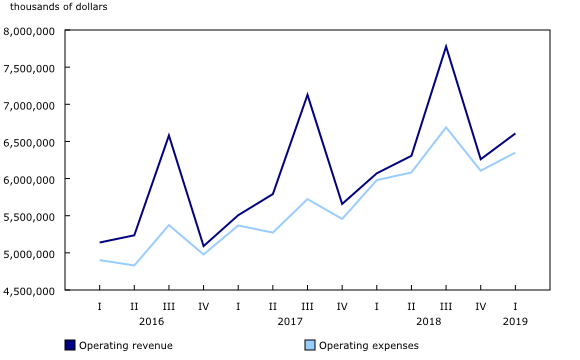
Operating revenue for the 26 largest Canadian air carriers totalled $6.6 billion in the first quarter, up 8.8% from the first quarter of 2018. The gain was driven primarily by increases in both passenger (+8.8%) and goods (+6.0%) revenue. Passenger revenue accounted for 89.8% of total operating revenue, while goods revenue comprised 5.6%. Total operating expenses grew 6.2% to $6.3 billion, mainly because of higher fuel prices year over year and increased capacity.
The number of air carriers increased from 25 in 2018 to 26 in 2019, as one Level III air carrier was reclassified to Level II.
The operating ratio for the largest airlines—operating expenses expressed as a proportion of operating revenue—was 0.96 in the first quarter, a slight improvement from 0.98 in the first quarter of 2018. Overall, this means that these airlines incurred expenses of roughly 96 cents to generate one dollar in revenue.
The major airlines record positive net income for the quarter
Net operating income almost tripled in the first quarter to $257.5 million. This amount, combined with a net non-operating income of $202.4 million, produced a net income of $460.0 million.
Canadian Level I and II air carriers spent $1.6 billion to purchase turbo fuel, up 7.0% compared with the same quarter in 2018. They also paid $1.2 billion in wages, salaries and benefits (+8.0%) to their 63,750 employees. The average number of employees was up 7.1% over the first quarter of 2018. Other operating expenses (56.0%) accounted for the largest share of total operating expenses in the first quarter of 2019, followed by turbo fuel (25.4%) and wages, salaries and benefits (18.6%).
These airlines recorded a profit margin—net income divided by operating revenue—of 7.0%. In other words, every dollar of service sold in the first quarter earned 7.0 cents of profit for these carriers.
Operating revenue per employee rose 1.6% year over year to $103,647 in the first quarter. The level of labour productivity, as measured by tonne-kilometres per employee, declined 1.1% compared with the first quarter of 2018 to 100,634 tonne-kilometres.
The number of passengers continues to rise
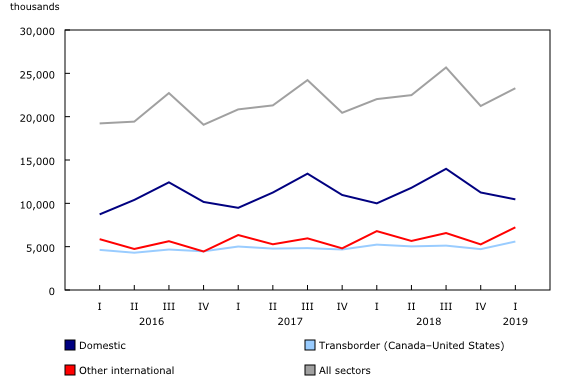
The 26 Canadian air carriers carried 23.3 million passengers in the first quarter, up 5.7% from the first quarter of 2018. The number of passengers flying on scheduled flights rose 5.9% to 22.7 million, while the passenger counts on chartered flights edged down 0.6% to 557,000. All three sectors posted gains. The domestic sector (within Canada) rose 4.6% to 10.5 million passengers, while the transborder sector (between Canada and the United States) grew 6.8% to 5.6 million passengers, and the other international sector increased 6.5% to 7.2 million passengers. Both transborder and other international sectors recorded their highest number of passengers since the first quarter of 2016 (the beginning of the data series).
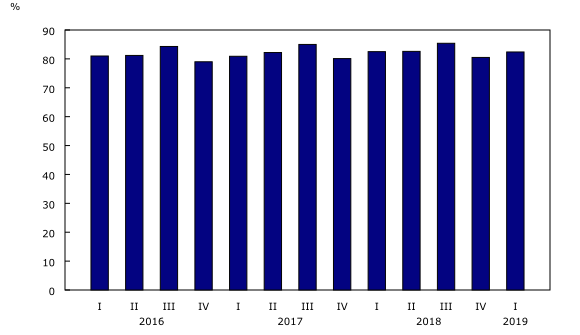
Traffic and capacity for scheduled services both recorded notable increases in the first quarter. Year over year, traffic was up 6.2% to 56.0 billion passenger-kilometres, while capacity rose 6.2% to 67.9 billion available seat-kilometres. As a result, the carriers recorded a passenger load factor of 82.4% for their scheduled services in the first quarter.
Note to readers
This release covers Canadian Level I and II air carriers. The number of air carriers increased from 25 in 2018 to 26 in 2019, as one Level III air carrier was reclassified to Level II. This carrier is not included in the 2018 data.
Level I air carriers include every Canadian air carrier that, in the calendar year before the year in which information is provided, transported at least 2 million revenue passengers or at least 400 000 tonnes of cargo.
Level II air carriers include every Canadian air carrier that, in the calendar year before the year in which information is provided, transported (a) at least 100,000 but fewer than 2 million revenue passengers; or (b) at least 50 000 tonnes but less than 400 000 tonnes of cargo.
Net non-operating income and loss are from commercial ventures that are not part of the air transportation services; from other revenues and expenses attributable to financing or other activities that are not an integral part of air transportation; and from special recurrent items of a non-periodic nature. Provision for income taxes is also included. Non-operating income can be, for example, capital gains from the sale of aircraft, interest income and foreign exchange adjustment, while non-operating expenses can include capital losses and interest on bank loans and other debt.
Data in this release are not seasonally adjusted.
Data for the first quarter of 2018 have been revised.
Because of rounding, components may not add up to the total.
Contact information
For more information, or to enquire about the concepts, methods or data quality of this release, contact us (toll-free 1-800-263-1136; 514-283-8300; STATCAN.infostats-infostats.STATCAN@canada.ca) or Media Relations (613-951-4636; STATCAN.mediahotline-ligneinfomedias.STATCAN@canada.ca).
- Date modified:


