Balance sheet of the agricultural sector, December 31, 2018
Archived Content
Information identified as archived is provided for reference, research or recordkeeping purposes. It is not subject to the Government of Canada Web Standards and has not been altered or updated since it was archived. Please "contact us" to request a format other than those available.
Released: 2019-06-20
$522.2 billion
2018
3.6% 
(annual change)
$0.3 billion
2018
3.8% 
(annual change)
$2.2 billion
2018
1.8% 
(annual change)
$2.3 billion
2018
-4.3% 
(annual change)
$2.1 billion
2018
-0.0% 
(annual change)
$53.6 billion
2018
2.6% 
(annual change)
$134.6 billion
2018
2.0% 
(annual change)
$40.1 billion
2018
2.4% 
(annual change)
$102.9 billion
2018
4.5% 
(annual change)
$148.2 billion
2018
5.0% 
(annual change)
$35.7 billion
2018
5.0% 
(annual change)
Equity in Canada's farm sector totalled $522.2 billion on December 31, 2018, up $18.1 billion (+3.6%) from the same date a year earlier. This follows a 6.4% year-over-year increase from 2016 to 2017 and continues a slowdown in the growth of farm equity following the double-digit gains of 2012 and 2013. The slowdown in equity growth in 2018 occurred against a backdrop of sharply lower farm income (realized net farm income fell 45.1% in 2018).
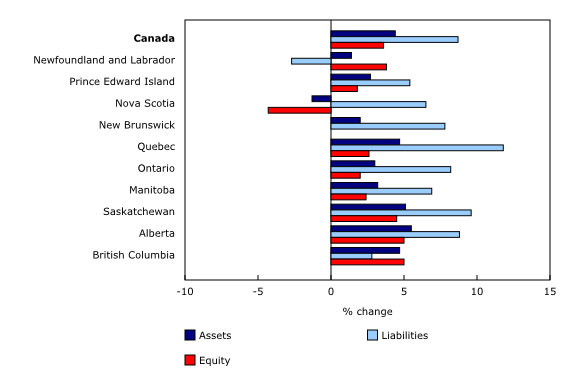
Farm equity rose in eight provinces, ranging from 1.8% in Prince Edward Island to 5.0% in Alberta and British Columbia. Farm equity was unchanged in New Brunswick and fell 4.3% in Nova Scotia, as the value of total assets in the province decreased 1.3%, while liabilities grew 6.5%.
Farm asset values increase as a result of gains in farmland values
The value of total farm assets rose 4.4% to $623.0 billion in 2018. Almost all of the increase came from a $24.2 billion gain in the value of farmland (+6.1%), which has been rising since 1993. Farmland values rose in every province except Nova Scotia (-4.9%). According to the Farm Credit Canada "Farmland Values Report," weakness in the blueberry sector as lower prices continued into the first half of 2018, reduced fruit and vegetable production in the wake of a June frost, and reduced dairy quota volumes contributed to a decline in demand for cultivated land in that province.
Decrease in value of crop inventories slightly moderates the increase in farmland values
The increase in farmland values in 2018 was partially offset by a $1.1 billion decline in the value of inventories (-3.2%), mainly due to a $834.8 million decrease in the value of crop inventories (-4.3%), led by lentils in Saskatchewan (-24.2%) and dry peas in Alberta (-27.8%). The imposition of duties by the Indian government in late 2017 on imports of lentils curtailed exports, sharply lowering prices. These duties also applied to dry peas with similar results.
Liabilities increase, resulting in a higher debt-to-asset ratio
Total liabilities increased 8.7% or $8.0 billion to $100.8 billion at the end of 2018. The debt-to-asset ratio, which measures the percentage of total assets that were financed by debt, rose from 15.5% in 2017 to 16.2% in 2018. This was the highest debt-to-asset ratio since 2011, slightly above the previous 10-year average of 15.9%.
Interest coverage ratio falls to lowest level since 2007
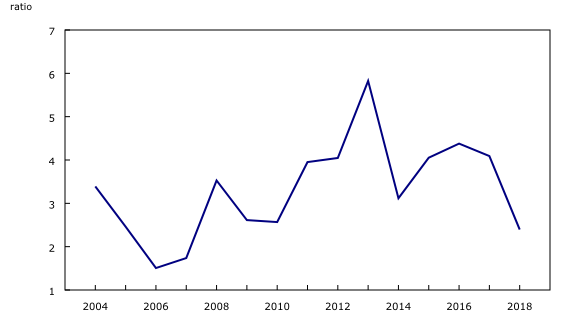
The interest coverage ratio, which measures the ability of the farm business to meet its interest payments (net income, before interest and taxes, divided by interest expenses), fell to 2.4 in 2018 from 4.1 a year earlier—its lowest value since 2007 (1.7).
Note to readers
The balance sheet of the agricultural sector provides the value of farm assets used to produce agricultural products, the liabilities associated with these assets and the farm sector equity as of December 31 for Canada and the provinces.
Assets and liabilities in the agriculture sector's balance sheet include those of farm businesses and non-operator landlords (for farm real estate assets leased to farm operators and the corresponding liabilities) and exclude the personal portion of farm households. This most closely reflects the assets and liabilities used in the production of agricultural products.
The balance sheet of the agricultural sector integrates data already produced by Statistics Canada, such as farm debt, value of farm capital, livestock and crop estimates, farm product prices and selected data from the Farm Financial Survey. These data are subject to revision.
Contact information
For more information, or to enquire about the concepts, methods or data quality of this release, contact us (toll-free 1-800-263-1136; 514-283-8300; STATCAN.infostats-infostats.STATCAN@canada.ca) or Media Relations (613-951-4636; STATCAN.mediahotline-ligneinfomedias.STATCAN@canada.ca).
- Date modified:


