Consumer Price Index: Annual review, 2018
Archived Content
Information identified as archived is provided for reference, research or recordkeeping purposes. It is not subject to the Government of Canada Web Standards and has not been altered or updated since it was archived. Please "contact us" to request a format other than those available.
Released: 2019-01-18
133.4
2018
2.3% 
(annual change)
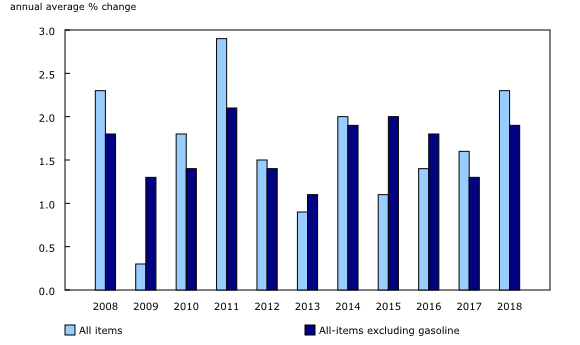
The annual average increase in the Consumer Price Index (CPI) was 2.3% in 2018, following gains of 1.6% in 2017 and 1.4% in 2016. The increase in 2018 was the largest since 2011 and coincided with strong labour market conditions, including a low unemployment rate throughout the year and strong wage growth in the first half of the year. Excluding gasoline, the annual average CPI rose 1.9%.
Component highlights
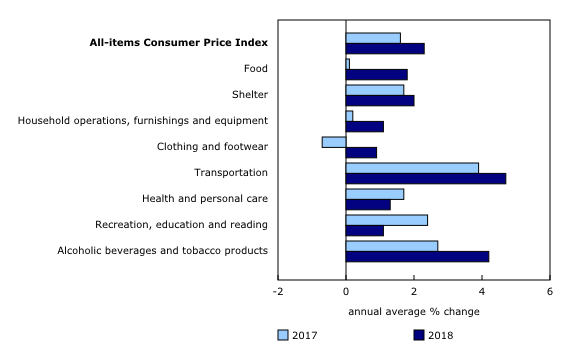
Prices were up on an annual average basis in all eight major components in 2018. The transportation index (+4.7%) was the largest contributor to the increase.
The cost of energy increased 6.7% in 2018, following a 5.3% gain in 2017. Consumer prices for gasoline rose more in 2018 (+12.6%) than in 2017 (+11.8%), as an increase in global crude oil prices and exchange rate pressures led to higher prices at the pump. Likewise, consumers paid 18.5% more for fuel oil and other fuels compared with the previous year.
In 2018, the services index rose 2.7%. Following a series of interest rate increases by the Bank of Canada, which impacted the lending rates offered by commercial banks, the mortgage interest cost index rose 4.7% in 2018 after increasing 0.2% in 2017. At the same time, the homeowners' replacement cost index, which is related to the price of new homes, rose less in 2018 (+1.6%) than in 2017 (+4.0%). Consumers paid less for traveller accommodation in 2018 compared with 2017, when significant price increases coincided with celebrations related to Canada's 150th birthday.
Prices for non-durable goods rose 2.8% in 2018, following a 1.4% gain in 2017. After a decline in 2017, prices for food purchased from stores rose 0.8% in 2018. The fresh vegetables index (+6.4%) contributed the most to the increase, following supply disruptions caused by severe weather patterns. Prices for eggs, meat and fresh fruit also increased after falling in 2017. Following a series of federal and provincial tax increases, consumers paid 8.1% more for cigarettes in 2018 compared with 2017. The cost of prescribed medicines fell 2.2% in 2018, after an agreement was reached between the generic drug industry and an alliance representing various public healthcare plans to reduce the price of generic medications.
Prices for durable goods (+0.2%) increased less in 2018 compared with 2017, as higher interest rates made it more expensive to finance large purchases. The purchase of passenger vehicles index (+1.5%) increased less in 2018 than in 2017. Prices for video equipment (-7.5%), furniture (-1.6%) and household appliances (-0.6%) declined in 2018.
Regional highlights
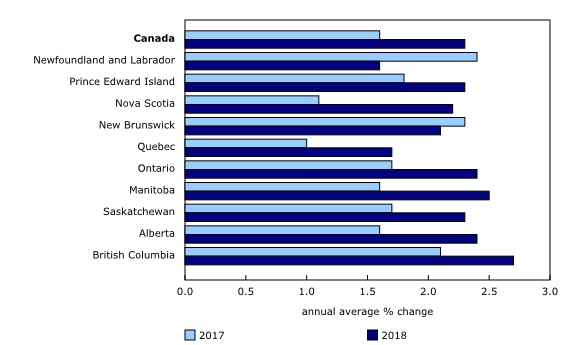
The annual average CPI increased in every province in 2018. In eight provinces, the increases were larger in 2018 than in 2017.
Consumers in Ontario paid more for food purchased from restaurants (+6.5%), child care and housekeeping services (+9.9%) and personal care services (+5.1%) in 2018, following smaller gains in 2017. These increases coincided with a legislated minimum wage increase in January.
In Alberta, electricity prices rose 27.5% in 2018, which was the largest increase since 2011. At the same time, consumers paid 8.5% less for natural gas in 2018, as a surplus in the commodity market drove consumer prices lower.
Note to readers
This release examines the percentage change between the annual average Consumer Price Index (CPI) in 2017 and 2018.
Annual average indexes are obtained by calculating the average of the 12 monthly index values over the calendar year. Annual average percent change should not be confused with the 12-month percent change that is published every month with the release of the CPI. Unlike the annual average change, the 12-month change compares the monthly index level with the level from the same month a year earlier.
Products
More information about the concepts and use of the Consumer Price Index are available in The Canadian Consumer Price Index Reference Paper (62-553-X).
Contact information
For more information, or to enquire about the concepts, methods or data quality of this release, contact us (toll-free 1-800-263-1136; 514-283-8300; STATCAN.infostats-infostats.STATCAN@canada.ca) or Media Relations (613-951-4636; STATCAN.mediahotline-ligneinfomedias.STATCAN@canada.ca).
- Date modified:


