Canadian Housing Statistics Program, 2018
Archived Content
Information identified as archived is provided for reference, research or recordkeeping purposes. It is not subject to the Government of Canada Web Standards and has not been altered or updated since it was archived. Please "contact us" to request a format other than those available.
Released: 2018-12-11
The Canadian Housing Statistics Program (CHSP), a program mostly based on administrative data, is publishing data for Nova Scotia for the first time along with new annual data for Ontario and British Columbia. The use of administrative data is a key element in Statistics Canada's modernization effort to produce statistical information that is comprehensive, cost effective and timely. Data under Statistics Canada's auspices are protected to ensure privacy and confidentiality.
Non-resident ownership rate is higher in Nova Scotia than in Ontario
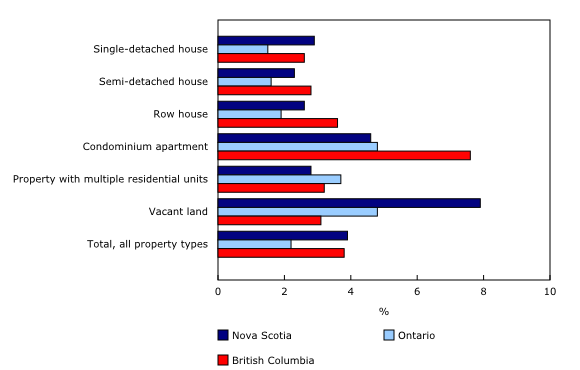
In Nova Scotia, 3.9% of residential properties are owned by non-residents, similar to the non-resident ownership rate in British Columbia (3.8%) but higher than that in Ontario (2.2%).
In British Columbia, the rate of non-resident ownership is highest for condominium apartments (7.6%), and row houses (3.6%). In contrast, in Ontario and Nova Scotia, the non-resident ownership rates are higher for vacant land and condominium apartments (chart 1).
Non-resident-owned properties represent 2.9% of the total assessed value of the residential property stock in Nova Scotia. This share is slightly higher than in Ontario (2.1%) but lower than in British Columbia (4.7%).
Non-resident ownership more prevalent in recreational destinations
Whether it be mountain resorts or cottage country, non-residents are attracted to recreational and vacation destinations outside of the metropolitan areas. Nearly one in four Nova Scotian properties owned by non-residents is located on Cape Breton Island. The town of Lunenburg, a UNESCO World Heritage Site along Nova Scotia's south shore, has a non-resident ownership rate of 6.2%, compared with the provincial rate of 3.9%.
The rates of non-resident ownership along the southern tip of Nova Scotia are also higher than the provincial average. Two ferry routes facilitate transport for Americans travelling to Nova Scotia: a high speed ferry route from Portland, Maine, United States, to Yarmouth, Nova Scotia, as well as a vehicle ferry from Saint John, New Brunswick, to Digby, Nova Scotia.
Similarly, in Whistler, British Columbia, home to one of North America's largest ski resorts, the non-resident ownership rate is 15.9%. In Ontario's cottage country, Muskoka Lakes has a non-resident ownership rate of 5.6% and Rideau Lakes has a non-resident ownership rate of 9.7%.
A profile of non-resident ownership in Cape Breton Island
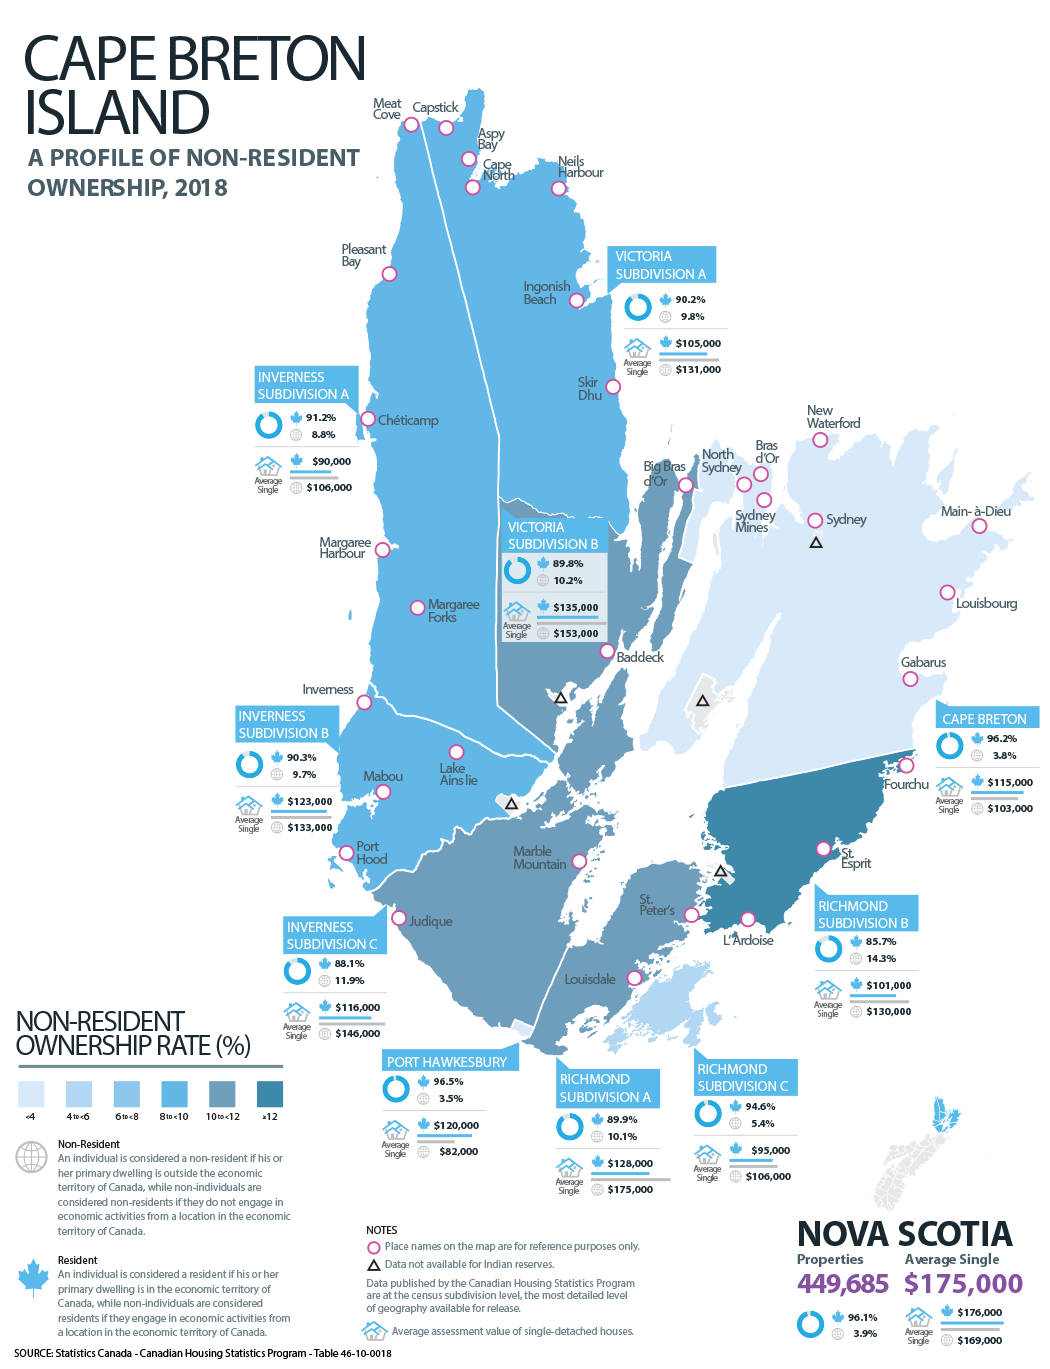
Of the 10 census subdivisions with the highest rates of non-resident ownership in Nova Scotia, 6 are located on Cape Breton Island, where the rate of non-resident ownership is 5.6%. Cape Breton Island is located in the north-eastern part of Nova Scotia and contains 10 census subdivisions: Inverness (subdivisions A, B and C), Richmond (subdivisions A, B and C), Victoria (subdivisions A and B), Port Hawkesbury, and Cape Breton Municipal District (see infographic, Cape Breton Island: A profile of non-resident ownership, 2018).
Developers have promoted Cape Breton vacation homes to buyers from outside Canada for decades, drawing attention to affordable prices and beautiful scenery. Richmond Subdivision B on the east side of Cape Breton has the highest rates of non-resident ownership in the province at 14.3%.
Outside the urban centres of Port Hawkesbury and Cape Breton Regional Municipality, single detached houses owned by non-residents have higher assessment values than those owned by residents. The average values of single-detached houses owned by non-residents are highest in Richmond Subdivision A ($175,000) and Victoria Subdivision B ($153,000). By comparison, for single-detached houses owned by residents in these same census subdivisions, the average value ranges from $128,000 to $135,000.
Non-resident ownership rate is lower in the Halifax CMA
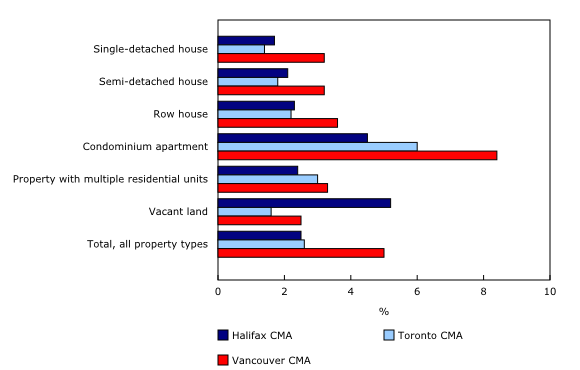
Among the largest census metropolitan areas (CMAs) in the three provinces, the non-resident ownership rate is highest in Vancouver (5.0%), followed by Toronto (2.6%) and Halifax (2.5%). Properties owned by non-residents represent 5.3% of the total assessed value of the residential property stock in the Vancouver CMA. The shares in the CMAs of Toronto and Halifax are closer to 2%.
Non-resident ownership rates in the CMAs of Vancouver and Toronto are highest for condominium apartments (8.4% in Vancouver and 6.0% in Toronto). For the Halifax CMA, the rate of non-resident ownership is highest for vacant land (5.2%) and condominium apartments (4.5%) (chart 2).
In the Halifax CMA, average assessment value of non-resident-owned properties is lower than that of resident-owned properties
The average assessment value of non-resident-owned properties in the Halifax CMA is lower than that of resident-owned properties. The most significant difference is for properties with multiple residential units. The average value of resident-owned properties with multiple residential units is $890,000, which is $510,000 higher than the average value of properties owned by non-residents.
In the CMAs of Vancouver and Toronto, average assessment values for single-detached houses, semi-detached houses, row houses and condominium apartments are higher for non-resident-owned compared with resident-owned properties. In the Vancouver CMA, the average value of a non-resident-owned, single-detached house is $2.3 million, or $690,000 higher than the average for a resident-owned property of this type. In the Toronto CMA, the average value of a non-resident owned single-detached house is $1 million, $160,000 higher than the average resident-owned single-detached house (table 1).
Average values tend to be higher in Nova Scotia's university communities
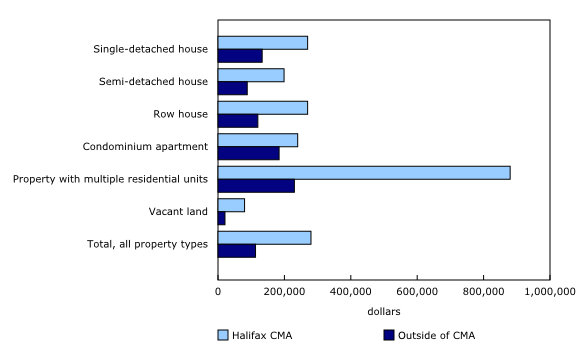
The average assessment value of a single-detached house, by far the most common property type in Nova Scotia, is $175,000. In the Halifax CMA, the average value of a single-detached house ($270,000) is more than twice the value found elsewhere in Nova Scotia ($133,000).
The average assessment value of a single-detached house tends to be higher in communities with large universities. Saint Mary's University and Dalhousie University are located in Halifax where the average value of this type of house is $270,000. Wolfville is home to Acadia University, where a single-detached house is valued at an average of $260,000, while in Antigonish, home to St. Francis Xavier University, the average value is $172,000.
On the whole, residential properties within the Halifax CMA have higher average assessment values than those located outside the CMA. The difference is most significant for properties with multiple residential units, where the average value is $880,000 in the Halifax CMA, compared with $230,000 outside the CMA (chart 3).
Single-detached houses and vacant land are more prevalent in Nova Scotia
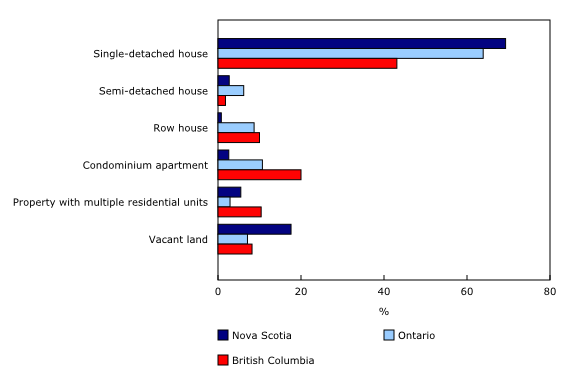
The stock of residential properties in Ontario (over 4.8 million) is more than 10 times the stock of residential properties in Nova Scotia (close to 450,000). In British Columbia, the stock of residential properties is more than 1.7 million. The overall mix of properties varies by province, although residential properties with single-detached houses are the most common type in all three provinces.
About two-thirds of residential properties are single-detached houses in Nova Scotia (69.3%) and Ontario (63.9%). This proportion is lower in British Columbia, where single-detached houses account for less than half (43.1%) of all residential properties. The second most common type of residential property in Nova Scotia is vacant land, which represents about one in five properties (17.6%). This proportion is more than double the proportions in both British Columbia (8.2%) and Ontario (7.1%) (chart 4).
One-fifth of residential properties (20.0%) in British Columbia is a condominium apartment, nearly twice the proportion found in Ontario (10.7%) and eight times the proportion in Nova Scotia (2.6%).
Condominium apartments are less common in the Halifax CMA
In all three provinces, the largest CMAs account for a significant proportion of the provincial residential property stock. Almost one-third of all residential properties in Nova Scotia are located in the Halifax CMA (32.7%), while the Toronto CMA accounts for 36.2% of Ontario's stock. The Vancouver CMA accounts for 44.9% of British Columbia residential properties.
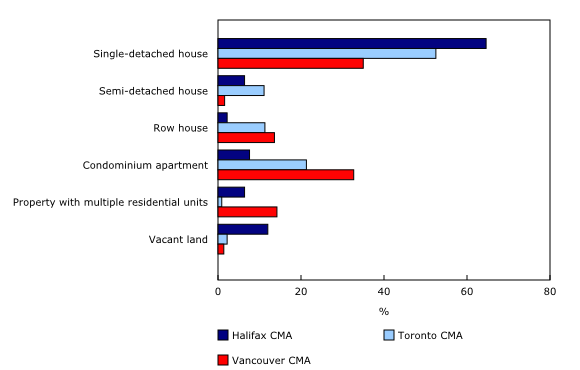
The prevalence of vacant land in the CMAs varies significantly between the Halifax CMA and the other two CMAs. In Halifax, more than 1 in 10 residential properties (12.0%) is vacant land. This proportion is considerably lower in the CMAs of Toronto (2.2%) and Vancouver (1.4%).
Despite the fact that the vast majority (95.0%) of Nova Scotia's condominium apartments are in the Halifax CMA, condominium apartments account for 7.6% of its residential properties. Single-detached houses account for almost two-thirds (64.6%) of residential properties in this CMA.
Nearly three-quarters (73.2%) of all condominium apartments in British Columbia are located in the Vancouver CMA. Condominium apartments account for 32.7% of properties in the CMA, and single-detached houses account for 35.0%.
Similar to the Vancouver CMA, the Toronto CMA accounts for 71.7% of Ontario's condominium apartments. Unlike Vancouver, however, condominium apartments account for 21.3% of properties in Toronto, while 52.5% of properties are single-detached houses (chart 5).
Non-individuals own less than 1 in 10 residential properties
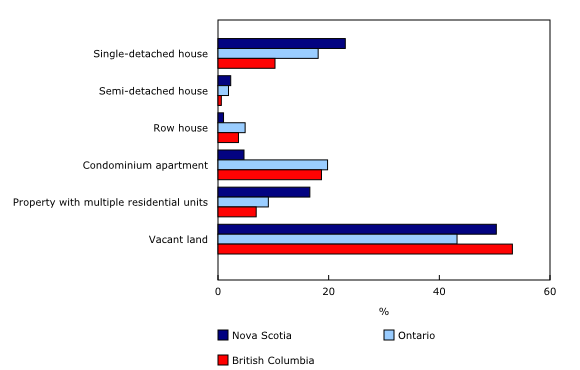
Non-individuals (for example, businesses, governments, and non-profit organizations) own similar proportions of the stock of residential properties in Nova Scotia, Ontario and British Columbia. In Nova Scotia, the non-individual ownership rate is 7.9%, which accounts for 13.2% of the total assessed value of the residential property stock in the province. The non-individual ownership rate in Ontario is 7.4%, accounting for 9.9% of the total assessed value. In British Columbia, the non-individual ownership rate is 9.8%, which represents 11.1% of the total assessed value.
Vacant land is the most common property type owned by non-individuals in the three provinces, accounting for over half of non-individual owned properties in Nova Scotia and British Columbia, and 43.2% in Ontario (chart 6).
The highest rate of non-individual ownership is in the London CMA
In the London CMA, almost one in five (19.7%) residential properties is owned by non-individuals, more than twice the rate of non-individual ownership in any other Ontario CMA. By comparison, Greater Sudbury has the second highest rate of ownership by non-individuals at 9.3%. While the Toronto CMA has the highest share (20.4%) of Ontario's non-individual-owned properties, the non-individual ownership rate in the CMA is 4.2% (table 2).
Just over two-thirds (67.9%) of residential properties owned by non-individuals in the London CMA are condominium apartments. In the Toronto CMA, vacant land represents the largest proportion of non-individual-owned properties at 34.9%, followed by condominium apartments at 23.2%.
In British Columbia, the non-individual ownership rate ranges from 5.2% in the Victoria CMA to 7.6% in the Kelowna CMA. In the Vancouver CMA, 5.6% of the residential properties are owned by non-individuals. Condominium apartments represent 44.0% of the non-individual-owned properties in the Vancouver CMA.
In Nova Scotia, non-individuals own 7.9% of the residential properties in the Halifax CMA, half of which is vacant land.
Note to readers
New data for Nova Scotia, Ontario and British Columbia
The Canadian Housing Statistics Program (CHSP) is publishing data for Nova Scotia for the first time. The CHSP is also publishing new annual data for Ontario and British Columbia.
The 2018 property assessment roll is used as the source for each province, and it will serve as the basis of a new annual series. Previous releases for Ontario and British Columbia reflected property stocks from mid-2017 and are not fully representative of the annual property assessment roll.
The 2018 property assessment data can be used to measure the stock of residential properties by year of construction, property type and assessment value. Property assessment data has been integrated with existing Statistics Canada data to measure the prevalence of residential property ownership by residents and non-residents of Canada, and by individuals and non-individuals (for example, businesses, governments and non-profit organizations). All variables in this new annual data series are available at the census subdivision level for all three provinces.
Data may be subject to revision
Data processing methodologies for the Canadian Housing Statistics Program continue to be improved. These changes may occasionally result in data revisions and may impact the comparability of data over time. Revisions may be more likely for Nova Scotia, where data is being released for the first time.
Definitions
Residential property refers to all land and structures intended for private occupancy, whether on a permanent or a temporary basis.
Property type refers to property characteristics and/or dwelling configuration, on which there can be one or more residential structures. Property type includes single-detached house, semi-detached house, condominium apartment, property with multiple residential units, unspecified property types, and vacant land.
Single-detached house refers to a single dwelling not attached to any other dwelling or structure (except its own garage or shed). A single-detached house has open space on all sides, and has no dwellings either above it or below it. A mobile home is also classified as a single-detached house.
Semi-detached house refers to one of two dwellings attached side by side (or back to back) to each other, but not attached to any other dwelling or structure (except its own garage or shed). A semi-detached dwelling has no dwellings either above it or below it, and the two units together have open space on all sides.
Row house refers to one of three or more dwellings joined side by side (or occasionally side to back), such as a townhouse or garden home, but not having any other dwellings either above or below. Townhouses attached to a high-rise building are also classified as row houses.
Condominium apartment refers to a set of living quarters that is owned individually, while land and common elements are held in joint ownership with others.
Property with multiple residential units refers to a property containing more than one set of living quarters owned by the same owner(s), as is the case for an apartment building or a duplex or a property with two houses on the same lot.
Vacant land refers to a property on which there are currently no residential structures, but where one can be built. Vacant land may also include land on which the residential structure has not yet been assessed or land on which a residential structure is present, but owned by another entity (for example, a mobile home in a mobile home park).
Assessment value refers to the assessed value of the property for the purpose of determining property taxes. It is important to note that the assessed value does not necessarily represent the market value. Given that different provinces and territories have their own assessment periods and durations of the valuation roll, it is difficult to make accurate comparisons of similar properties from one province or territory to another. For properties that are being utilized for both residential and non-residential purposes, only the residential partitions' value has been taken into account.
Property owner refers to an individual or non-individual (such as a corporation, trust, state-owned entity or related groups) that has property title transferred to, recorded in, registered in or otherwise carried in their name. A property may have more than one owner or an owner may have more than one property.
Ownership type refers to whether an owner of a residential property is an individual or a non-individual entity such as a corporation, trust, state-owned entity or non-profit.
In the context of residential property, assignment of ownership type is as follows: a property is considered owned by an "individual" if all owners of a property are individuals. Conversely, properties are deemed owned by "non-individuals" if all owners are non-individuals, or if the owners are a combination of individuals and non-individuals.
Residency status is assigned based on whether the owner is an individual or a non-individual. An individual is considered a resident if his or her primary dwelling is in the economic territory of Canada. Non-individuals are considered residents if they engage in economic activities from a location in the economic territory of Canada. Similarly, an individual is considered a non-resident if his or her primary dwelling is outside the economic territory of Canada. Non-individuals are considered non-residents if they do not engage in economic activities from a location in the economic territory of Canada.
In the context of residential property, assignment of residency status is as follows: a property is considered owned by residents when the majority of owners is defined as resident. Conversely, a property is considered owned by non-residents when the majority of owners is defined as non-resident. In the situation where there is an equal number of resident and non-resident owners for the same property, the property is classified as owned by residents.
Information about residential property investment in Cape Breton Island was taken from the article 'Why Cape Breton is attracting holiday home buyers' (Troy McMullen, Financial Times, September 22, 2017), and from the publication Exploring the Implications of Non-Resident Land Ownership in Nova Scotia (Heather Breeze, 1998), which is available on the Collections Canada website.
Products
Thematic Maps "Nova Scotia — Proportion of residential properties owned by non-residents, by census subdivision (CSD), 2018", "Ontario — Proportion of residential properties owned by non-residents, by census subdivision (CSD), 2018" and "British Columbia — Proportion of residential properties owned by non-residents, by census subdivision (CSD), 2018" (39260001), are now available.
The infographics "Who invests in Nova Scotia's housing market", "Who invests in Ontario's housing market," and "Who invests in British Columbia's housing market," as part of Statistics Canada — Infographics (11-627-M), are also available.
Contact information
For more information, or to enquire about the concepts, methods or data quality of this release, contact us (toll-free 1-800-263-1136; 514-283-8300; STATCAN.infostats-infostats.STATCAN@canada.ca) or Media Relations (613-951-4636; STATCAN.mediahotline-ligneinfomedias.STATCAN@canada.ca).
- Date modified:


