Production of principal field crops, November 2018
Archived Content
Information identified as archived is provided for reference, research or recordkeeping purposes. It is not subject to the Government of Canada Web Standards and has not been altered or updated since it was archived. Please "contact us" to request a format other than those available.
Released: 2018-12-06
Canadian farmers reported increased production of wheat and barley in 2018, while canola, corn for grain, soybeans and oat production was down from the previous year.
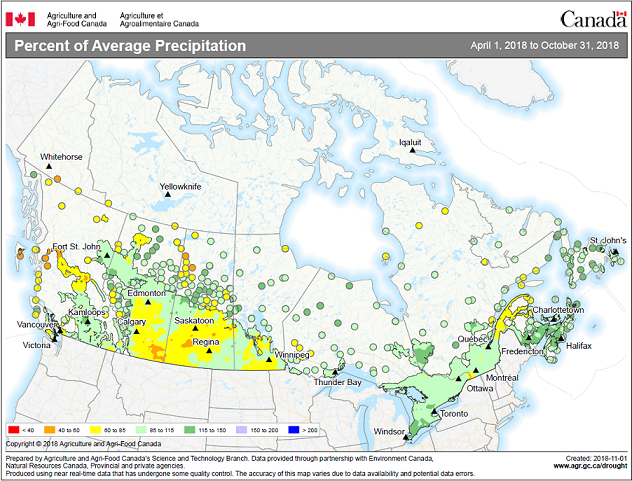
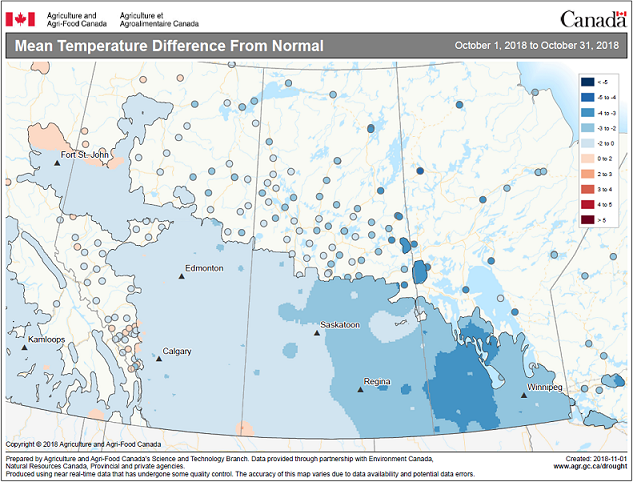
Despite dry conditions, especially in the Prairie provinces throughout the spring and early summer (see map 1), increased precipitation in some regions in late July and August helped crop growth. However, snow and cold temperatures (see map 2) in some parts of the country delayed harvest and may have affected the overall quality and quantity of the crop.
Wheat
Nationally, farmers reported producing 31.8 million tonnes of wheat in 2018, up 6.0% from 2017. The increase in production was driven by larger harvested area, which rose 2.2 million acres from 2017 to 2018. This offset lower yields, which fell 1.8 bushels per acre to 47.8 bushels per acre.
A larger harvested area in Saskatchewan, up 14.0% from 2017 to 12.8 million acres, pushed wheat production higher in the province. The increase came despite yields falling 0.8 bushels per acre to 41.4 bushels per acre. Overall, farmers reported producing 14.4 million tonnes of wheat, up 11.7% from 2017.
In Alberta, wheat production increased 0.3% from 2017 to 10.0 million tonnes in 2018. The rise came despite lower yields, which fell from 52.6 bushels per acre to 49.7 bushels per acre (-5.5%), as total harvested area rose 6.1% to 7.4 million acres.
Farmers in Manitoba reported producing 4.7 million tonnes of wheat in 2018, up from 4.4 million tonnes in 2017. Increased production was mainly driven by a larger harvested area, which rose from 2.7 million acres to 2.9 million acres. The rise in harvested area offset decreases in yield, which edged down from 59.8 bushels per acre to 59.5 bushels per acre.
In Ontario, all wheat production decreased 4.3% to 2.2 million tonnes in 2018. Farmers reported that yields were down 2.5 bushels per acre from 2017 to 81.2 bushels per acre. Harvested area fell 1.4% to 995,500 acres. In Ontario, 91.8% of all wheat harvested is winter wheat, accounting for 82.7% of all winter wheat production in Canada.
Canola
Total canola production declined from 21.3 million tonnes in 2017 to 20.3 million tonnes in 2018. The decrease in production was due to lower harvested area and lower yields. Harvested acres fell from 22.9 million acres to 22.5 million acres. Farmers reported an average yield of 39.8 bushels per acre, 2.9% lower than in 2017. High temperatures and low precipitation early in the growing season, coupled with colder than normal temperatures and heavy snowfall during the harvest season, may have affected crop quality and reduced yields.
In Saskatchewan, farmers reported that yields rose 1.0% from 2017 to 39.3 bushels per acre in 2018. Harvested area decreased from 12.7 million acres to 12.2 million acres. As a result, total production in the province declined by 254 000 tonnes to 10.9 million tonnes.
Farmers in Alberta reported producing 5.9 million tonnes of canola in 2018, down from 6.8 million tonnes in 2017. Yields declined 11.2% to 38.8 bushels per acre, while harvested area fell by 210,800 acres (-3.1%) to 6.7 million acres.
Production in Manitoba rose 5.4% from 2017 to 3.3 million tonnes in 2018. Yields fell from 44.0 bushels per acre to 43.3 bushels per acre. Lower yields were offset by larger harvested area, which increased by 224,100 acres to 3.4 million acres.
Corn for grain
At the national level, farmers reported production of 13.9 million tonnes of corn for grain in 2018, down from 14.1 million tonnes in 2017. Harvested area increased 1.7% to 3.5 million acres. Reported yields were down 3.2% to 154.6 bushels per acre. Corn farmers benefited from high temperatures throughout much of June and July. However, lower than average precipitation during the growing season may have affected overall yields.
Ontario, which accounts for the largest proportion of corn for grain produced in Canada, reported that yields edged down from 167.0 bushels per acre in 2017 to 166.0 bushels per acre in 2018. Despite the slight drop, yields remained 7.8 bushels above the 10-year average. Farmers reported that harvested area rose 1.0% to 2.1 million acres. As a result of higher harvested acres, production increased by 29 400 tonnes to 8.8 million tonnes.
Farmers in Quebec reported that production fell 4.2% from 2017 to 3.6 million tonnes in 2018. Harvested area rose 1.4% to 947,400 acres. However, greater harvested area was offset by lower yields, which fell from 159.3 bushels per acre to 150.4 bushels per acre.
Soybeans
Farmers reported that soybean production fell from 7.7 million tonnes in 2017 to 7.3 million tonnes in 2018. Lower production was driven by smaller harvested area, down 13.5% to 6.3 million acres. Yields increased by 3.4 bushels per acre (+8.7%) to 42.5 bushels per acre.
Harvested area in Ontario declined 1.8% to 3.0 million acres in 2018. Despite lower harvested area, farmers reported that yield increased 12.7% to 51.4 bushels per acre. As a result, soybean production in Ontario rose 403 900 tonnes to 4.2 million tonnes. High temperatures and increased precipitation later in the growing season likely contributed to higher yields compared with 2017.
Harvested area in Manitoba declined for the first time since 2007, falling from 2.3 million acres in 2017 to 1.9 million acres in 2018. Yields fell from 36.1 bushels per acre to 31.1 bushels per acre. Smaller harvested area and lower yields led to a 29.6% drop in production, from 2.2 million tonnes to 1.6 million tonnes.
In Quebec, farmers reported that soybean production rose from 1.1 million tonnes in 2017 to 1.2 million tonnes in 2018. Although harvested area declined 6.7% to 912,700 acres, yields increased from 41.9 bushels per acre to 46.9 bushels per acre.
Barley and oats
Canadian farmers reported that barley production increased from 7.9 million tonnes in 2017 to 8.4 million tonnes in 2018. Although yields fell from 69.4 bushels per acre to 65.0 bushels per acre, a 13.3% increase in harvested area to 5.9 million acres drove production higher.
Nationally, the production of oats decreased from 3.7 million acres in 2017 to 3.4 million acres in 2018. Lower oat production was driven by a 3.7% decrease in yield to 89.7 bushels per acre, as well as an 116,000 acre decline in harvested area to 2.5 million acres.
Note to readers
The November Farm Survey of crop production covering approximately 26,800 Canadian farms was conducted from October 5 to November 13, 2018. Farmers were asked to report their estimated seeded and harvested areas, yield and production of grains, oilseeds and special crops. This survey collected data from every province.
This release provides the final production estimates for 2018, which are subject to revision for two years.
Auxiliary data sources
Readers are invited to visit the Crop Condition Assessment Program web application, which is an additional tool to assess growing conditions of field crops during the crop year. Readers can monitor a vegetation index of crop land on a weekly basis.
Crop Reporting Survey at a Glance: An easy-to-print chart, which provides an overview of our survey cycle, is now available.
The Effects of the Crop Reporting Cycle in field crop statistics, 2008 to 2018 examines the differences between the preliminary and final estimates for field crop statistics, and the impact of the crop cycle on these estimates.
Products
The infographic "Fields of Gold: Canola exports and production," which is part of Statistics Canada—Infographics (11-627-M), is now available.
Contact information
For more information, or to enquire about the concepts, methods or data quality of this release, contact us (toll-free 1-800-263-1136; 514-283-8300; STATCAN.infostats-infostats.STATCAN@canada.ca) or Media Relations (613-951-4636; STATCAN.mediahotline-ligneinfomedias.STATCAN@canada.ca).
- Date modified:


