Wholesale trade, September 2018
Archived Content
Information identified as archived is provided for reference, research or recordkeeping purposes. It is not subject to the Government of Canada Web Standards and has not been altered or updated since it was archived. Please "contact us" to request a format other than those available.
Released: 2018-11-21
$63.2 billion
September 2018
-0.5% 
(monthly change)
$343.2 million
September 2018
-3.5% 
(monthly change)
$75.3 million
September 2018
-4.1% 
(monthly change)
$835.9 million
September 2018
-1.6% 
(monthly change)
$533.9 million
September 2018
-2.6% 
(monthly change)
$11,720.6 million
September 2018
-1.4% 
(monthly change)
$32,035.6 million
September 2018
-0.5% 
(monthly change)
$1,668.8 million
September 2018
5.0% 
(monthly change)
$2,312.3 million
September 2018
0.0% 
(monthly change)
$6,944.0 million
September 2018
-0.4% 
(monthly change)
$6,683.4 million
September 2018
-0.4% 
(monthly change)
$11.5 million
September 2018
2.4% 
(monthly change)
$73.9 million
September 2018
11.9% 
(monthly change)
$9.5 million
September 2018
-7.5% 
(monthly change)
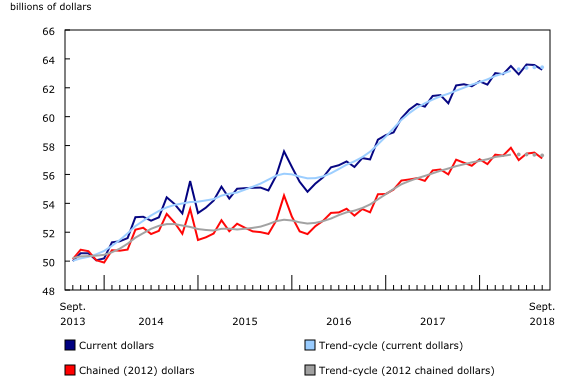
Wholesale sales declined for a second consecutive month, down 0.5% to $63.2 billion in September. Lower sales were recorded in five of seven subsectors, led by the machinery, equipment and supplies and the personal and household goods subsectors.
In volume terms, wholesale sales declined 0.7%.
In the third quarter, wholesale sales increased 0.6% in current dollars, while constant dollar sales were unchanged. This was the 10th consecutive quarterly increase in current dollars.
Lower sales in five subsectors
In September, lower sales were recorded in five of seven subsectors, which together accounted for 68% of total wholesale sales.
Following two consecutive monthly gains, sales in the machinery, equipment and supplies subsector declined for the second time in 2018, down 2.0% to $13.0 billion in September. Sales declined in three of the four industries, led by the computer and communication equipment and supplies (-3.3%) and the farm, lawn and garden machinery and equipment (-6.4%) industries.
Sales in the personal and household goods subsector declined 1.6% to $9.0 billion, its second decline in five months. Five of six industries reported declines, with a 17.4% decrease in the toiletries, cosmetics and sundries industry contributing the most to the decline in September.
Sales in the food, beverage and tobacco subsector declined 0.7% to $11.9 billion, led by the food industry (-0.6%).
Sales in the building material and supplies subsector increased 1.5% to $9.5 billion, following a 3.9% decline in August. The lumber, millwork, hardware and other building supplies industry (+3.0%) contributed the most to the gain.
Sales in the motor vehicle and parts subsector rose 0.3% to $10.8 billion. All industries posted higher sales, led by the motor vehicle industry (+0.3%).
On a quarterly basis, the personal and household goods (+3.2%) and the food, beverage and tobacco (+0.9%) subsectors contributed the most to the gain in the third quarter. The motor vehicle and parts subsector declined for the third consecutive quarter (-2.3%).
Sales down in eight provinces, led by Quebec and Ontario
Wholesale sales in Quebec declined for the third time in 2018, down 1.4% to $11.7 billion in September. Sales were down in two of the seven subsectors, led by the motor vehicle and parts subsector. This subsector declined for the second consecutive month, down 12.9% to $1.3 billion. The building material and supplies subsector declined 7.9% to $1.8 billion in September, nearly offsetting the 8.6% increase in August.
Sales in Ontario decreased for the second consecutive month, dropping 0.5% to $32.0 billion. Declines were led by the machinery, equipment and supplies (-3.5%) and the personal and household goods (-3.2%) subsectors. In the machinery, equipment and supplies subsector, sales fell for the fourth time in five months, while sales in the personal and household goods subsector were down following three consecutive monthly gains.
Wholesale sales edged down 0.4% in both Alberta and British Columbia in September. Sales in Alberta fell to $6.9 billion as a result of lower sales in the machinery, equipment and supplies (-2.9%) and the miscellaneous (-5.2%) subsectors. In British Columbia, four of seven subsectors declined, led by the miscellaneous subsector (-10.4%).
In September, sales in the Atlantic provinces were down. Sales in Nova Scotia decreased for the fourth consecutive month, down 1.6% to $836 million in September, led by the motor vehicle and parts subsector. Wholesale sales in New Brunswick (-2.6% to $534 million), Newfoundland and Labrador (-3.5% to $343 million) and Prince Edward Island (-4.1% to $75 million) declined for the third time in four months. The food, beverage and tobacco subsector led the declines in New Brunswick and Newfoundland and Labrador.
In Manitoba, sales increased for the third consecutive month, up 5.0% to $1.7 billion in September, their highest level on record. The gain was attributable to higher sales in all the subsectors. The miscellaneous (+9.6%) and the machinery, equipment and supplies (+6.8%) subsectors were the main contributors to the gain.
Inventories rise in September
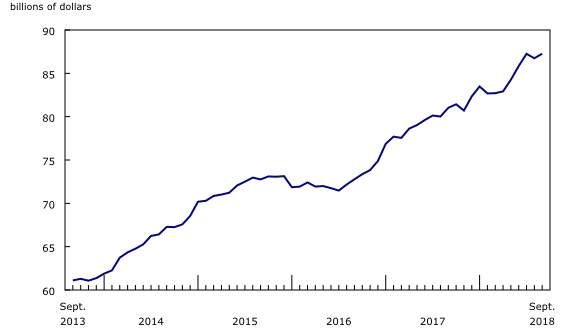
Wholesale inventories were up 0.6% to $87.3 billion in September, offsetting the 0.6% decrease in August. Increases were recorded in three of seven subsectors in September, which together accounted for 64% of total wholesale inventories.
In dollar terms, the building material and supplies subsector (+2.4%) recorded the largest gain, as inventories rose in all industries.
The machinery, equipment and supplies subsector (+1.1%) posted its fifth consecutive monthly gain in inventories in September.
Inventories in the motor vehicle and parts subsector (-0.9%) declined for the fourth time in 2018.
The inventory-to-sales ratio increased from 1.36 in August to 1.38 in September. This ratio is a measure of the time in months required to exhaust inventories if sales were to remain at their current level.
British Columbia wildfires and evacuations
For the reference month of September, the Monthly Wholesale Trade Survey added nine supplementary questions to assess the impact of the British Columbia wildfires and evacuations from July to September 2018.
For the September reference month, approximately 3,000 companies responded to the supplementary questions. Of these companies, 123 wholesalers (about 4%) indicated that their businesses had been affected by the wildfires at some point from July to September.
Responses that indicated an impact were recorded in each of the seven subsectors encompassed by the Monthly Wholesale Trade Survey and touched all provinces, with the exception of Newfoundland and Labrador and Prince Edward Island.
The most common type of impact felt during this time was disruptions in transportation. This included both receiving inventories and distributing goods to clients. Of the 123 wholesalers that indicated they experienced impacts, 7 stated that their businesses were shut down entirely and ranged from just days to multiple months.
While responses pointed toward a negative impact in most cases, five businesses stated increased sales.
Overall, while some businesses faced hardship from this extreme event, the impact of the wildfires on total wholesale sales in Canada was likely small.
Note to readers
During the monthly collection process, there is now an option to enable a module with a limited number of questions that can be used to assess the consequences of an ad hoc event on the data series. The module is added after the core questions of the survey have been asked and can be directed to the whole sample or to a specific domain (province/territory and subsector/industry).
For the reference month of September 2018, the Monthly Wholesale Trade Survey added nine supplementary questions to assess the impact of the British Columbia wildfires and evacuations over the period from July to September 2018 among all its survey respondents.
All data in this release are seasonally adjusted and expressed in current dollars, unless otherwise noted. For information on seasonal adjustment, see Seasonally adjusted data – Frequently asked questions.
Effective with the September 2018 release of the wholesale trade estimates on November 21, 2018, wholesale sales estimates disseminated by Manufacturing and Wholesale Trade Division have been converted from a 2007 reference year to a 2012 reference year for its volume and price estimates. Constant price estimates and their associated price index are now using 2012 as their base year. Adopting a new reference year did not affect constant dollars sales estimates growth rates over the period 2004 to 2011, as it represents a rescaling of the 2007-based data. However, levels and growth rates of the estimates for the period of 2012 to date have been affected by revisions to estimates at current prices and to price indices.
The Monthly Wholesale Trade Survey covers all industries within the wholesale trade sector as defined by the North American Industry Classification System (NAICS), with the exception of oilseed and grain merchant wholesalers (NAICS 41112), petroleum and petroleum products merchant wholesalers (NAICS 412) and business-to-business electronic markets, and agents and brokers (NAICS 419).
For information on trend-cycle data, see the StatCan Blog and Trend-cycle estimates – Frequently asked questions.
Real-time data tables
Real-time data tables 20-10-0019-01, 20-10-0020-01 and 20-10-0005-01 will be updated on December 3.
Next release
Wholesale trade data for October will be released on December 20.
Contact information
For more information, contact us (toll-free 1-800-263-1136; 514-283-8300; STATCAN.infostats-infostats.STATCAN@canada.ca). For analytical information, or to enquire about the concepts, methods or data quality of this release, contact John Burton (613-862-4878; john.burton@canada.ca), Manufacturing and Wholesale Trade Division.
- Date modified:


