Crude oil and natural gas: Supply and disposition, July 2018
Archived Content
Information identified as archived is provided for reference, research or recordkeeping purposes. It is not subject to the Government of Canada Web Standards and has not been altered or updated since it was archived. Please "contact us" to request a format other than those available.
Released: 2018-10-11
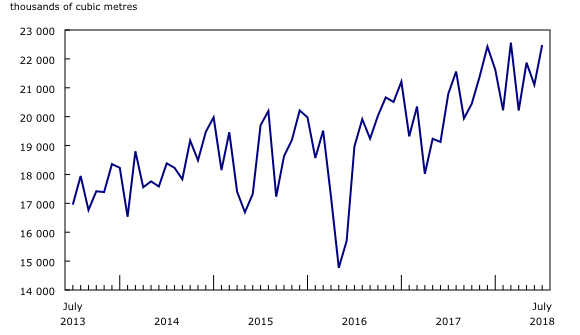
Canada produced 22.5 million cubic metres (141.4 million barrels) of crude oil and equivalent products in July, up 8.1% compared with the same month in 2017.
Production increases continue
The rise in production of crude oil and equivalent products in July was primarily attributable to a 15.2% increase in non-upgraded crude bitumen to a record high of 9.3 million cubic metres. This surpassed the previous high of 9.1 million cubic metres in May 2018. Non-upgraded crude bitumen production consisted of in-situ crude bitumen (+5.8%), plus mined crude bitumen (+6.9%), minus crude bitumen sent for further processing (-5.7%).
Light and medium crude oil (+10.5%), equivalent products (+14.2%) and heavy crude oils (+0.2%) also contributed to the overall increase in monthly production.
Meanwhile, production of synthetic crude oil declined 3.6% in July.
Oil sands extraction and oil extraction
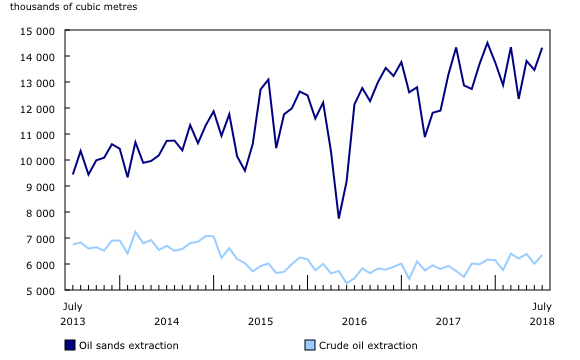
Crude oil production (excluding equivalent products) totalled 20.7 million cubic metres in July, up 7.6% from the same month a year earlier.
Oil sands extraction, which consists of non-upgraded crude bitumen and synthetic crude oil, increased 7.9% from July 2017 to 14.3 million cubic metres. Over the same period, extraction of light, medium and heavy crude oils rose 7.1% to 6.3 million cubic metres.
Provincial production
Alberta produced 18.2 million cubic metres of crude oil and equivalent products in July, up 8.4% from the same month a year earlier.
Alberta (81.1%), Saskatchewan (10.6%) and Newfoundland and Labrador (5.7%) accounted for the vast majority of Canadian production.
Exports and imports
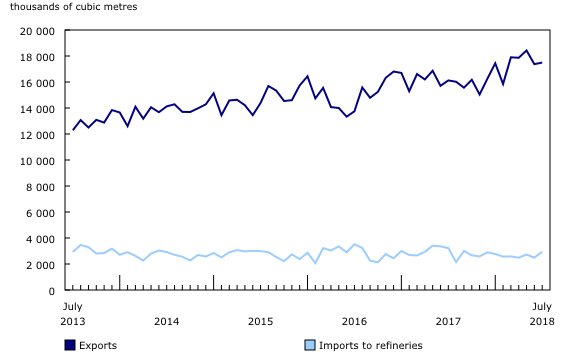
Exports of crude oil and equivalent products were up 8.5% to 17.5 million cubic metres in July. Exports to the United States by pipelines rose 4.3%, to 15.2 million cubic metres. Meanwhile, exports by other means (including rail, truck and marine) continued to increase, with a monthly average volume of 2.3 million cubic metres from January to July, compared with 1.7 million cubic metres over the same period in 2017.
Meanwhile, imports of crude oil to refineries fell 8.2% to 3.0 million cubic metres.
Closing inventories
Closing inventories of crude oil and equivalent products totalled 18.6 million cubic metres in July, up 7.4% from the same month in 2017. Increases in inventories held by transporters (+10.9%) and fields and plants (+12.3%) were the main contributors to the overall increase, while inventories held at refineries fell 9.3%.
Natural gas production
Canadian marketable natural gas production totalled 14.5 billion cubic metres in July, up 6.1% from the same month a year earlier. Production of natural gas was concentrated in Alberta (68.8%) and British Columbia (29.1%).
Additional information on natural gas is available in "Natural gas transmission, storage and distribution," published in The Daily on September 24, 2018.
Note to readers
Data on crude oil and equivalent products, previously found in table 25-10-0014, are now published in table 25-10-0063. While table 25-10-0014 will remain available for reference, users should exercise caution when comparing data with those of the new table.
Information on the disposition of crude oil and equivalent products to refineries by province and on exports to the United States by district were discontinued. New data on imports, exports, input to Canadian refineries and inventories were added to table 25-10-0063.
As of the January 2018 reference month, in accordance with the North American Industry Classification System 2017 update, conventional crude oil will be referred to as crude oil extraction, while non-conventional crude oil will be referred to as oil sands extraction.
Data from June 2018 have been revised.
Crude oil and equivalent products include heavy, light and medium crude oil, synthetic crude oil, crude bitumen, condensate, and pentanes plus.
Export data are a combination of National Energy Board data and survey respondents' data.
Import data include imports of crude oil by refineries and by others.
Total marketable gas includes receipts from fields, gas gathering systems and/or gas plants.
The crude oil and natural gas supply and disposition program uses respondent data as well as administrative data provided by federal, provincial and territorial authorities with regulatory responsibilities within their respective jurisdictions.
Contact information
For more information, or to enquire about the concepts, methods or data quality of this release, contact us (toll-free 1-800-263-1136; 514-283-8300; STATCAN.infostats-infostats.STATCAN@canada.ca) or Media Relations (613-951-4636; STATCAN.mediahotline-ligneinfomedias.STATCAN@canada.ca).
- Date modified:


