

 |
|
 |                |
Information identified as archived is provided for reference, research or recordkeeping purposes. It is not subject to the Government of Canada Web Standards and has not been altered or updated since it was archived. Please "contact us" to request a format other than those available.

|

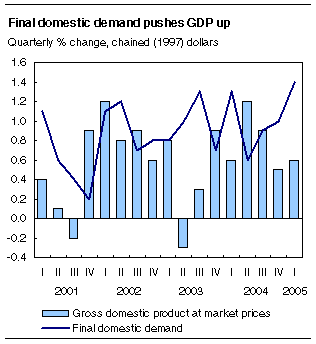
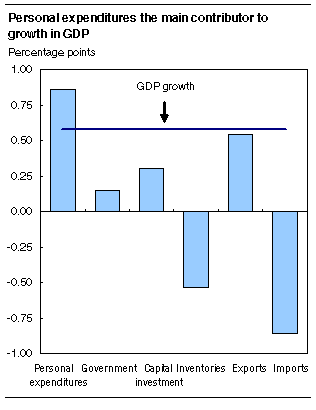
Tuesday, May 31, 2005 Canadian economic accountsFirst quarter 2005 and March 2005Real gross domestic product (GDP) grew 0.6% in the first quarter of 2005, a slight acceleration from the previous quarter, boosted by consumer spending and strong growth in business investment in plant and equipment. Exports rebounded after two quarters of decline. 
In March, economic output declined 0.1% after increasing 0.2% in both January and February. Overall, the Canadian economy grew at an annualized rate of 2.3% in the first three months of the year, compared with an annualized rate of 3.5% for the US economy. Consumer spending surged ahead 1.5%, led by strong increases in purchases of durable and semi-durable goods, such as home furnishings, and clothing and footwear. The surge in consumer expenditures was felt throughout the economy and, combined with growth in government spending and business investment, helped push final domestic demand up 1.4%.
Output in the retail and wholesale trade sectors jumped by more than 2.0%, and retailers reported widespread growth in profits. Overall, corporate profits increased 3.7% in the first quarter, a marked improvement over the last half of 2004 but still well off the 8% pace set in the first and second quarters of 2004.
For the second quarter in a row, growth in the services industries (+0.9%) out-performed the goods industries, where output edged down 0.1%. The jump in final domestic demand and increase in exports served to slow down the large inventory accumulation that occurred in the last half of 2004. While inventories continued to accumulate in the first quarter, trade inventories accumulated at a much slower pace, especially wholesale inventories, while the build-up of manufacturing inventories was similar to the previous quarter. The strong growth in personal spending was coupled with an increase in consumer borrowing and moderate growth in personal income, such that the household sector's saving rate fell below zero. Despite the marked trend since 2000 by the household sector to increasingly borrow to finance spending on housing and big-ticket items, the ratio of interest payments to disposable income remains at a low of 7.6%, relative to the peak of 9.4% in 1995. The national saving rate sat at 11%, as the $5 billion run down in household saving was more than offset by the 9.9% increase in corporate saving, surpassing the $100 billion dollar mark. 
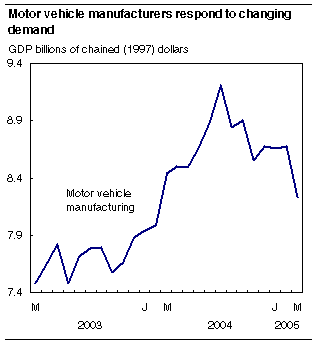
Industrial production (the output of factories, mines and utilities) decreased 0.2% as the mining, oil and gas sector receded. Manufacturing output increased a slight 0.3%, due in large part to machinery and electronic equipment manufacturers who were busy exporting. Overall exports increased 1.5% after two quarters of decline, bolstered by exports of machinery and equipment (+4.1%) and energy products (+5.6%). Business investment in residential construction declined 0.4%, as the value of new housing construction declined 1.6%, following six consecutive quarterly increases. The majority of this decline resulted from a substantial decline in the construction of single dwellings in the first quarter. In contrast, investment in non-residential construction posted its largest increase in six quarters (+1.8%). Economy-wide prices, as measured by the chain price index for GDP, rose 0.4% again this quarter. GDP by industry: Highlights for March 2005Economic activity declined 0.1% in March, in large part restrained by a reduction in output of motor vehicles, as manufacturers tailored their production to changing demand. Manufacturing output decreased 0.9%, dragged down by the automotive sector with declines in both motor vehicles (-5.1%) and parts (-3.8%). Weakness in the manufacturing sector was widespread, as 15 of the 21 major groups decreased, accounting for 71% of the sector's value added. 
Activity in the mining and oil and gas extraction sector fell 0.9% in March, pulled down by reductions in oil and gas extraction (-0.6%), and in support activities (-7.3%). Oil producers in the tar sands were busy re-establishing their output levels following a series of problems that plagued the industry since January. Construction activity decreased 0.3% in March. Residential construction reported its third and steepest consecutive monthly decline (-1.4%), while non-residential building construction edged up 0.1%. Engineering, repairs and other construction activity also increased 0.5%. Wholesaling activity rose 0.8% in March. The largest gains were reported by wholesalers of machinery and electronic equipment, and personal and household products. Retailing activity decreased 0.2%, following strong growth in January and February. Food and beverage stores reported the largest gains, and automotive stores recorded the largest decreases.
Detailed analysis and tablesMore detailed analysis on today's releases from the national accounts, including additional charts and tables, can be found in the first quarter 2005 issue of Canadian Economic Accounts Quarterly Review, Vol. 4, no. 1 (13-010-XIE, free). From the Our products and services page, under Browse our Internet publications, choose Free, then National accounts. Products, services and contact informationGross domestic product by industryAvailable on CANSIM: tables 379-0017 to 379-0022. Definitions, data sources and methods: survey numbers, including related surveys, 1301 and 1302. The March 2005 issue of Gross Domestic Product by Industry, Vol. 19, no. 3 (15-001-XIE, $12/$118) is now available. A print-on-demand version is available at a different price. Data on GDP by industry for April will be released on June 30. For general information or to order data, contact Yolande Chantigny (1-800-887-IMAD; imad@statcan.gc.ca). To enquire about the concepts, methods or data quality of this release, contact Bernard Lefrançois (613-951-3622; imad@statcan.gc.ca), Industry Measures and Analysis Division. National economic and financial accountsAvailable on CANSIM: tables 026-0009, 378-0001, 378-0002, 380-0001 to 380-0017, 380-0019 to 380-0035, 380-0056, 380-0059 and 382-0006. Definitions, data sources and methods: survey numbers, including related surveys, 1804, 1901 and 2602. The first quarter 2005 issue of National Income and Expenditure Accounts, Quarterly Estimates (13-001-XIB, $36/$117) will soon be available. A print-on-demand version is available at a different price. Detailed printed tables of unadjusted and seasonally adjusted quarterly data on income and expenditure accounts (13-001-PPB, $54/$193), financial flow accounts (13-014-PPB, $54/$193) and estimates of labour income (13F0016XPB, $22/$70), including supplementary analytical tables and charts are now available. At 8:30 am on release day, the complete seasonally adjusted quarterly income and expenditure accounts, financial flow accounts, and monthly estimates of labour income data sets can be obtained on computer diskette. The diskettes (13-001-DDB, $134/$535; 13-014-DDB, $321/$1,284; and 13F0016DDB, $134/$535) can also be purchased at a lower cost seven business days after the official release date (13-001-XDB, $27/$107; 13-014-XDB, $65/$257; and 13F0016XDB, $27/$107). To purchase any of these products, contact Client Services (613-951-3810; iead-info-dcrd@statcan.gc.ca), Income and Expenditure Accounts Division. For more information, or to enquire about the concepts, methods or data quality of this release, contact the information officer (613-951-3640), Income and Expenditure Accounts Division.
| |||||||||||||||||||||||||||||||||||||||||||||||||||||||||||||||||||||||||||||||||||||||||||||||||||||||||||||||||||||||||||||||||||||||||||||||||||||||||||||||||||||||||||||||||||||||||||||||||||||||||||||||||||||||||||||||||||||||||||||||||||||||||||||||||||||||||||||||||||||||||||||||||||||||||||||||||||||||||||||||||||||||||||||||||||||||||||||||||||||||||||||||||||||||||||||||||||||||||||||||||||||||||||||||||||||||||||||||||||||||||||||||||||||||||||||||||||||||||||||||||||||||||||||||||||||||||||||||||||||||||||||||||||||||||||||||||||||||||||||||||||||||||||||||||||||||||||||||||||||||||||||||||||||||||||||||||||||||||||||||||||||||||||||||||||
|
|
|