
Police-reported hate crime in Canada, 2019
by Greg Moreau, Canadian Centre for Justice and Community Safety Statistics
Highlights
- Canada is a multicultural and diverse country, with a growing proportion of Canadians who are designated as members of visible minority groups, whose mother tongue is a language other than English or French, or who are affiliated with non-Christian religions. Additionally, the Indigenous population of Canada is projected to grow relatively quickly over the next two decades. As such, informing on the experiences of a diverse population, such as the nature and extent of hate-motivated crime, is more relevant than ever.
- In 2019, police reported 1,946 criminal incidents in Canada that were motivated by hate. Hate crimes accounted for less than 0.1% of the over 2.2 million police-reported crimes in 2019 (excluding traffic offences).
- The number of police-reported hate crimes increased by 7%, or 129 more incidents, in 2019 compared to the previous year. In 2017, the number of hate crimes increased markedly by 47% and has remained at comparable levels in 2018 and 2019.
- Between 2018 and 2019, the number of police-reported crimes motivated by hatred of a race or ethnicity increased 10%, from 793 to 876. Much of this increase was a result of more hate crimes targeting the Black (+40 incidents) and Arab or West Asian populations (+35 incidents).
- Police-reported hate crimes targeting sexual orientation increased 41% in 2019 to 263 incidents, compared with 186 incidents a year earlier.
- For the second year in a row there was a decline in the number of police-reported hate crimes motivated by religion, declining from 657 to 608 incidents (-7%). This decrease was due to fewer police-reported crimes motivated by hate against the Jewish population, which declined from 372 incidents to 296 incidents in 2019 (-20%). Hate crimes against the Muslim population rose slightly in 2019, from 166 to 181 incidents (+9%).
- Hate crimes targeting the Black and Jewish populations remained the most common types of hate crimes, representing 18% and 16% of all hate crimes, respectively. As well, hate crimes targeting sexual orientation accounted for 14% of all hate crimes.
- In 2019, almost all provinces and all territories reported increases, including British Columbia (+49 incidents), Ontario (+43 incidents), Quebec (+23 incidents), New Brunswick (+18 incidents) and Manitoba (+14 incidents). Only the province of Alberta reported a decrease from 2018, with 38 fewer incidents.
- Increases were reported in the census metropolitan areas (CMAs) of Vancouver (+24 incidents) and Québec (+24 incidents), while 2019 saw fewer hate crime incidents in Calgary (-37 incidents), Montréal (-27 incidents) and Kitchener-Cambridge-Waterloo (-24 incidents). Overall, there was a larger increase in police-reported hate crimes outside of CMAs (+86 incidents, +37%) compared to within CMAs (+43 incidents, +3%).
- Based on the reported characteristics of hate crimes, both non-violent hate crimes (+6%) and violent hate crimes (+8%) increased in 2019. As in other years, non-violent hate crimes accounted for the majority of incidents (56%). Compared to 2018, there were increases in all types of non-violent hate crime, including general mischief (+48 incidents) and public incitement of hatred (+12 incidents). The number of violent hate crimes rose from 798 to 861, the result of increases in common assault (+24%) and uttering threats (+12%).
- Multi-year analysis shows that victims of police-reported violent hate crimes targeting sexual orientation and the Indigenous population tend to be the youngest among hate crime victims and sustain the highest rate of injury.
Canada is a multicultural and diverse country. According to the 2016 Census, 22.3% of Canadians were designated as visible minorities, an increase of 3% since the 2011 National Household Survey.Note First Nations people, Métis and InuitNote comprised 4.9% of the population in 2016, up from 4.3% in 2011 (Statistics Canada 2013a). The proportion of people who reported religious affiliations other than Christianity has also grown. In 2011, 7.2% of the Canadian population identified as Muslim, Hindu, Sikh or Buddhist compared to 4.9% in 2001.Note The Jewish population has remained stable at 1% from 2001 to 2011 (Statistics Canada 2013b).
According to demographic projections, the proportion of Canadians designated as members of visible minority groups and the proportion who are affiliated with non-Christian religions are expected to increase. In particular, by 2036, more than one in three working-age Canadians (15 to 64 years of age) are expected to be members of a visible minority group, and the number of Canadians with a non-Christian religion is expected to increase from 9% in 2011 to between 13% and 16% of the population in 2036 (Statistics Canada 2017a). It is also expected that over half the immigrants in Canada will be of Asian origin (Statistics Canada 2017a). South Asian and Chinese populations are expected to continue to be the largest visible minority groups in Canada, while Arab or West Asian populations are expected to grow the fastest over the next two decades (Statistics Canada 2017a).
The COVID-19 pandemic, which hit Canada in March 2020, brought to light the varying experiences and perceptions of some of Canada’s diverse population, as well as the systemic barriers they face, including levels of safety and victimization. For instance, Chinese (30%), Korean (27%), and Southeast Asian (19%) participants in a recent crowdsourcing survey were the most likely to perceive an increase in the frequency of harassment or attacks based on race, ethnicity or skin colour as a result of COVID-19 (Heidinger and Cotter 2020). Thus, it is important to note that the police-reported statistics from 2019 do not reflect the large-scale societal impacts, both nationally and globally, brought about by the COVID-19 pandemic, as this information is not yet available. The 2019 police-reported hate crime data will, however, be a key reference point for the 2020 police-reported data, in order to identify possible changes in Canadian crime patterns as a result of factors related to the pandemic.
Regardless of the pandemic, individuals designated as visible minorities generally report feeling less safe than the rest of the population and certain groups are much more likely to report experiencing discrimination (Simpson 2018a). Hate crimes target the integral and visible parts of a person’s identity and may affect not only the individual but also the wider community (Office for Democratic Institutions and Human Rights 2018; Perry 2010). As this behaviour affects individuals, their communities and society generally, hate crimes are a focus of social concern in Canada and other countries. As a member of the Office for Democratic Institutions and Human Rights of the Organization for Security and Co-operation in Europe, Canada works with other countries to monitor and combat hate crimes (Office for Democratic Institutions and Human Rights 2014).Note
This Juristat article presents the most recent trends in police-reported hate crime in Canada using data from the Uniform Crime Reporting Survey (see Text box 1). More specifically, this article examines the number of hate crime incidents reported by police in 2019 as well as the characteristics of these incidents, the victims and the accused involved.Note Due to the relatively small annual counts and variability in reporting of hate crime, some analysis of characteristics of hate crime incidents, victims and accused in this article is based on total hate crimes reported from 2010 to 2019.
This article was made possible with funding from the Department of Canadian Heritage.
Start of text box 1
Text box 1
Police-reported hate crime statistics
Definition and coverage
The Uniform Crime Reporting (UCR) Survey collects police-reported crimes, including information on hate crimes. The UCR defines police-reported hate crime as follows:
“Police-reported hate crime is defined as a criminal violation against a person or property motivated by hate, based on race, national or ethnic origin, language, colour, religion, sex, age, mental or physical disability, sexual orientation or gender identity or expression, or any other similar factor.”
In addition to police-reported incidents that involve a hate crime motivation, there are four specific offences listed as hate propaganda and hate crimes in the Criminal Code of Canada: advocating genocide; incitement of hatred in a public place that is likely to lead to a breach of the peace [public incitement of hatred]; wilful promotion of hatred, all when directed against an identifiable group, and; mischief motivated by hate in relation to property primarily used for religious worship that, in late 2017, was expanded to include certain other kinds of property primarily used by an identifiable group.Note In addition, subparagraph 718.2(a)(i) of the Criminal Code allows for increased penalties when sentencing any criminal offence, such as assault or mischief, where there is evidence that the offence was motivated by bias, prejudice or hatred based on various criteria as set out in that subparagraph. These are also considered hate crimes.Note
Since 2005, Statistics Canada has collected data on hate crimes according to this standard definition from police services in Canada via the UCR. As per Bill C-16 “An Act to amend the Canadian Human Rights Act and the Criminal Code”, the definition of hate crime was amended in 2017 to add gender identity or expression as a motivation. This updated definition of hate crime was endorsed by the Canadian Association of Chiefs of Police and is the standard used for data collection purposes as well as training by police services across Canada. Statistics Canada has worked closely with hate crime experts and the policing community Canada-wide to build standards and guidelines in identifying and reporting hate-motivated crimes.
Police-reported hate crimes are reported as criminal incidents. A criminal incident involves one or more related offences that are committed during a single criminal event and have been reported to police. Where there are multiple victims or accused within a single criminal event, one incident is still recorded, with multiple victim or accused records linked to it. For example, a single incident involving an assault on three victims at the same time and location is counted as one incident of assault. When analyzing victim counts, there would be a count of three victims of assault.
Determination of a hate crime by police
Within the UCR Survey, depending on the level of evidence at the time of the incident, police can record the incident as either a “suspected” or “confirmed” hate-motivated crime. As more information is gathered, incidents are reviewed and verified and as a result, their status may be reclassified. This analysis includes crimes that have been confirmed to be, or are strongly suspected to be, motivated by hate. Suspected hate crimes may include criminal incidents that cannot be confirmed as hate crimes, but for which there is sufficient evidence to suspect that they are motivated by hate, e.g., hate graffiti where no accused has been identified.
It is important to note that victims of hate crimes targeting specific populations are not necessarily members of those specific populations. For example, if someone is assaulted and there is anti-Muslim language used during the assault, the hate crime will be considered anti-Muslim whether or not the victim is Muslim. The hate crime is classified by the perception of the accused, not by the characteristics of the victim.
Interpretation of police-reported numbers
Police data on hate-motivated crimes include only those incidents that come to the attention of police services and also depend on a police service’s level of expertise in identifying crimes motivated by hate. As a result, an increase in numbers may be related to more reporting by the public to the authorities (for example, as a result of outreach by police to communities or heightened sensitivity after high profile events), and/or a true increase in the extent of hate crimes being committed. As with other crimes, self-reported data provide another way of monitoring hate-motivated crimes. According to the 2014 General Social Survey on Canadian’s Safety (Victimization), Canadians self-reported being the victim of over 330,000 criminal incidents that they perceived as being motivated by hate (5% of the total self-reported incidents) in the 12 months preceding the survey. Two-thirds of these incidents were not reported to the police, according to respondents (see Text box 2). This is in contrast to the 1,295 incidents of hate crime reported by police in that same year.
Over the past two decades, police services across Canada have continued to advance their identification and reporting of hate crime incidents. Based on publicly available information, as of December 2020, 15 of the 20 largest municipal police services in Canada had dedicated hate crime units or hate crime officers. Moreover, in an effort to try to address the under-reporting of hate crimes, a growing number of non-governmental organizations are developing innovative methods to encourage the reporting of hate. In 2017, for example, the Alberta Hate Crimes Committee (AHCC) launched the StopHateAB.ca website to encourage reporting of hate incidents in order to support strategies that foster a public social environment of justice, equity, and human rights. As such, changes in reporting practices can have an effect on hate crime statistics. It is therefore important to recognize that, according to police services, higher rates of police-reported hate crime in certain jurisdictions may reflect differences or changes in the recognition, reporting and investigation of these incidents by police and community members.
Due to the impact of changes in reporting practices and the variability of hate crime, particularly by motivation or in jurisdictions where numbers are small, changes over time should be interpreted with caution.
End of text box 1
Hate-motivated crime up from 2018 and remains higher than previous 10 year average
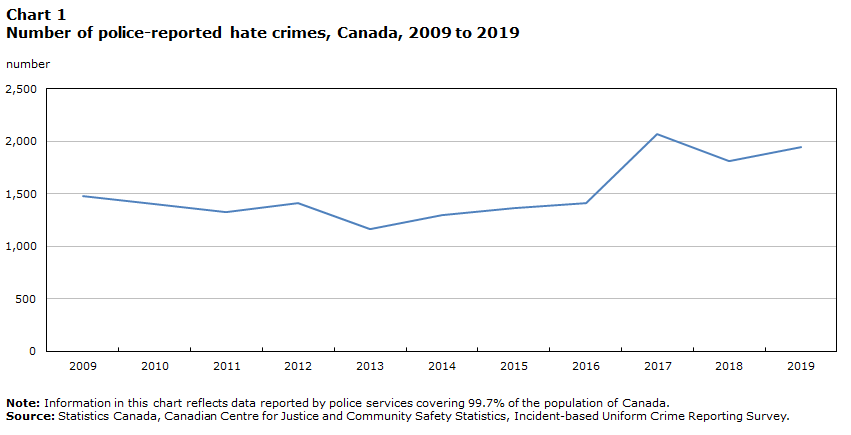
The number of police-reported hate crimes in Canada was up 7% in 2019, rising from 1,817 incidents to 1,946. This increase is similar to the overall increase in police-reported crime (excluding traffic offences). Overall, hate crimes accounted for less than 0.1% of the over 2.2 million police-reported crimes in 2019 (excluding traffic offences) (Moreau 2020). The year-over-year increase was the result of increases throughout the country, as only Alberta reported a decrease from 2018 (-38 incidents).
Since the availability of comparable data in 2009, the number of police-reported hate crimes has ranged from a low of 1,167 incidents in 2013 to a high of 2,073 in 2017. On average, there have been approximately 1,518 hate crime incidents reported annually by police since 2009 (Chart 1). Although changes over time could reflect real increases in the number of hate crimes, differences or changes in the recognition, reporting by victims and investigation of these incidents by police and community members could also have had an impact on these trends (see Text box 1).
Chart 1 start
Data table for Chart 1
| Year | Number |
|---|---|
| 2009 | 1,482 |
| 2010 | 1,401 |
| 2011 | 1,332 |
| 2012 | 1,414 |
| 2013 | 1,167 |
| 2014 | 1,295 |
| 2015 | 1,362 |
| 2016 | 1,409 |
| 2017 | 2,073 |
| 2018 | 1,817 |
| 2019 | 1,946 |
|
Note: Information in this chart reflects data reported by police services covering 99.7% of the population of Canada. Source: Statistics Canada, Canadian Centre for Justice and Community Safety Statistics, Incident-based Uniform Crime Reporting Survey. |
|
Chart 1 end
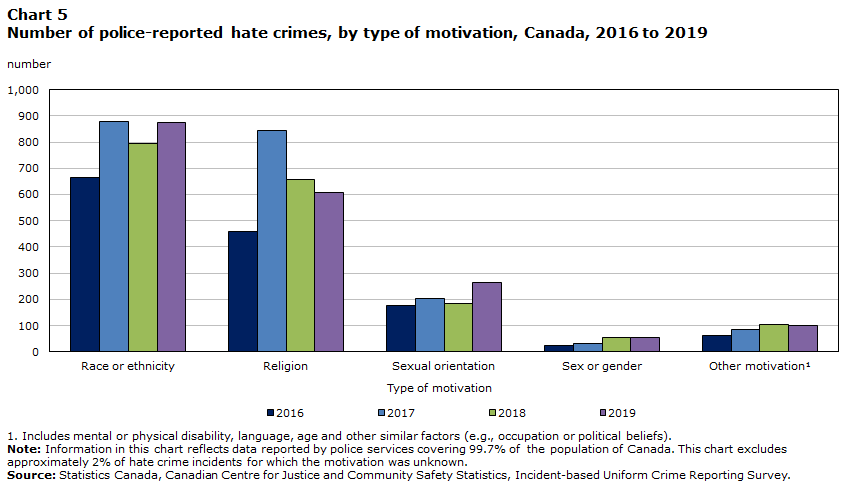
In 2019, hate crimes motivated by hatred of a race or ethnicity represented 46% of all hate crimes, followed by those targeting religion (32%) (Table 1). Crimes motivated by hatred of a sexual orientation accounted for 14% of hate crimes, up from 10% the previous two years, while those targeting other factors such as language, disability, age, and sex comprised 8%.
Nationally, there were more police-reported hate crimes targeting race or ethnicity (+10%), specifically the Arab or West Asian population (+38%) and the Black population (+14%), as well an increase in crimes targeting sexual orientation (+41%). In 2019, while there were fewer police-reported hate crimes targeting religion (-7%), including the Jewish population (-20%), those targeting the Muslim population rose (+9%). Hate crimes targeting the Black population accounted for 18% of hate crimes in 2019, while those targeting the Jewish and Muslim populations accounted for 16% and 10%, respectively.
Overall in 2019, more than half of hate crime incidents (56%) were non-violent, the same proportion as in 2018 (Table 2). Both non-violent (+6%) and violent (+8%) hate crimes increased in 2019, contributing nearly equally to the overall increase in hate crime. The increase in non-violent hate crimes was primarily due to a 7% increase in general mischief offences.Note Mischief in relation to property used primarily for worship or by an identifiable group increased 1%. There was also a 16% increase in public incitement of hatred. The rise in violent hate crimes was driven by increases in incidents of common assault (+24%) and uttering threats (+12%). Overall in 2019, 44% of hate crimes were violent, the same proportion as in 2018 (Table 2).
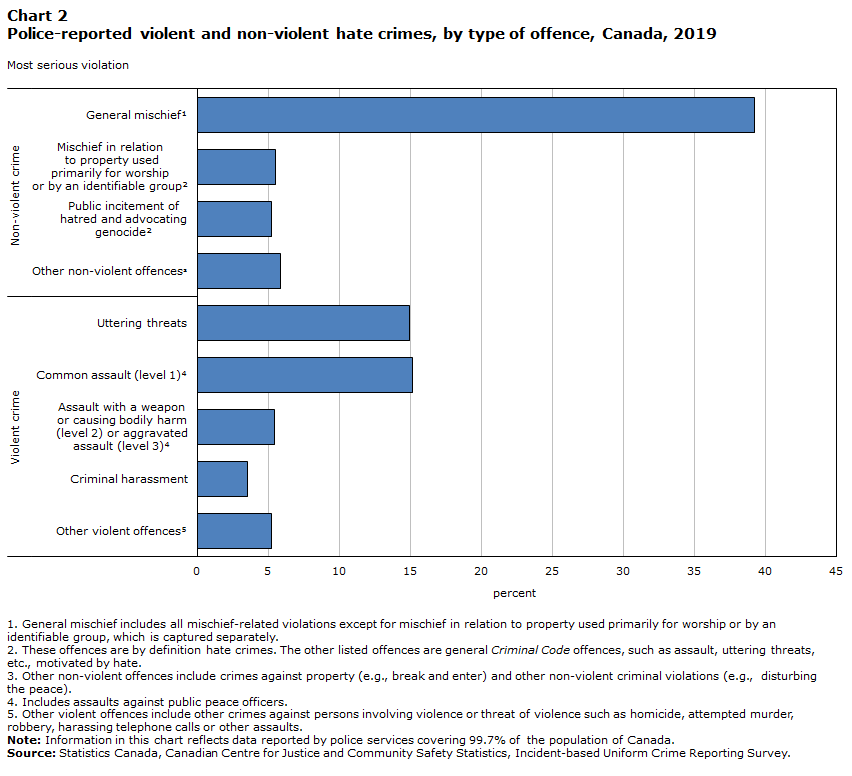
In 2019, the vast majority (89%) of police-reported hate crimes were offences other than the four offences explicitly defined as hate crimes under the Criminal Code. When examining these four offences specifically within the context of all hate crimes, 5% were mischief in relation to property primarily used for religious worship or by an identifiable group (107 incidents), 5% were public incitement of hatred or wilful promotion of hatred (89 incidents), and fewer than 1% involved advocating genocide (12 incidents) (Table 2).
With 870 incidents in 2019, mischief continues to be the most common type of hate crime, accounting for 45% of incidents (Chart 2). Compared to other violations, mischief tends to be an important driver in changes in hate crime as fluctuations can have a relatively large impact on trends across motivations. Common assaults are the most common police-reported violent crime and the most common violent hate-motivated crime. There were 295 incidents of common assault and 290 incidents of uttering threats that were motivated by hate in 2019, each accounting for 15% of all hate crimes in 2019 (Chart 2).
Chart 2 start
Data table for Chart 2
| Most serious violation | Percent |
|---|---|
| Non-violent crime | |
| General mischiefData table for Chart 2Note 1 | 39 |
| Mischief in relation to property used primarily for worship or by an identifiable groupData table for Chart 2Note 2 | 5 |
| Public incitement of hatred and advocating genocideData table for Chart 2Note 2 | 5 |
| Other non-violent offencesData table for Chart 2Note 3 | 6 |
| Violent crime |
|
| Uttering threats | 15 |
| Common assault (level 1)Data table for Chart 2Note 4 | 15 |
| Assault with a weapon or causing bodily harm(level 2) or aggravated assault (level 3)Data table for Chart 2Note 4 | 5 |
| Criminal harassment | 3 |
| Other violent offencesData table for Chart 2Note 5 | 5 |
Source: Statistics Canada, Canadian Centre for Justice and Community Safety Statistics, Incident-based Uniform Crime Reporting Survey. |
|
Chart 2 end
Start of text box 2
Text box 2
Self-reported victimization data on hate-motivated incidents
Information on self-reported victimization is collected every five years by the General Social Survey (GSS) on Canadian’s Safety (Victimization). This survey asks a sample of Canadians, aged 15 years and older, if they had been a victim in the previous 12 months of any of the following offences: sexual assault, robbery, physical assault, break and enter, theft of motor vehicles or parts, theft of household property, theft of personal property, and vandalism. If respondents indicate that they had been victimized, they are subsequently asked if they believed that the incident had been motivated by hate and, if so, to state the motivation(s).
The latest GSS on Victimization was collected in 2019/2020, with analysis of data available later in 2021. One notable change made to the survey questionnaire for 2019 is the inclusion of gender identity or expression as a perceived reason for hate crime in the definition of a hate crime: “There is a growing concern in Canada about hate crimes. By this we mean crimes motivated by the offender’s hatred of a person’s sex, gender identity or expression, ethnicity, race, religion, sexual orientation, age, disability or language.” For more detailed information on the GSS and its collection, refer to the GSS survey information page.Note
It is important to note that data collected by the GSS differ from police-reported data. Information from the GSS is based upon the perceptions of individuals regarding whether or not a crime occurred and what the motivation for the crime may have been. Data on self-reported victimization provide information on incidents that may or may not have come to the attention of police. In contrast, information from police is based on incidents that have been substantiated through investigation. The police use strict legal criteria to determine whether or not a crime is motivated by hate and to indicate the type of motivation. They also look at information gathered during the investigation and adhere to national guidelines in order to define and classify the incident as a hate crime. Police-reported data also depend on whether victims are willing to report hate crimes to an official body.
Overall, according to the latest published GSS data from 2014, about two-thirds of individuals who said they had been victims of hate-motivated incidents did not report the incidents to the police. Of the victims who did not report the hate crime targeting themselves, 64% said they did not report it because they thought the police would not have considered the incident important enough. Similarly, 62% felt that the crime was minor and not worth taking the time to report to the police. Another reason, cited by 58% of victims, was the belief that the accused would not be convicted or adequately punished.Note For more detailed analysis of GSS data as it relates to hate crimes, refer to Text box 2 in the “Police-reported hate crime in Canada, 2017” report (Armstrong 2019).
End of text box 2
Most provinces and all territories reported increases in hate crime
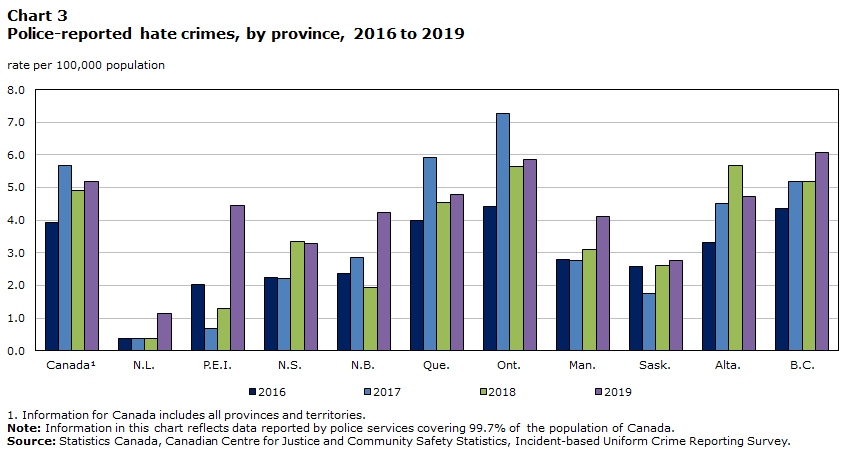
In 2019, eight of ten provinces and all three territories reported increases in police-reported hate crime, most notably British Columbia (+49 incidents), Ontario (+43 incidents), Quebec (+23 incidents), New Brunswick (+18 incidents) and Manitoba (+14 incidents). In contrast, Alberta had 38 fewer incidents in 2019 and Nova Scotia had no change from 2018, with 32 reported incidents (Table 3).
Typically, Canada’s three most populous provinces have had the highest rates of hate crime in the country (Chart 3). The increases in British Columbia, Ontario and Quebec were largely due to more hate crimes targeting race or ethnicity and sexual orientation. Specifically, in British Columbia and Quebec, police-reported increases in hate crimes targeting the Arab or West Asian populationNote (+7 incidents and +19 incidents, respectively) and the Black population (+16 incidents and +5 incidents), while in Ontario, police-reported more hate crimes targeting the Black population (+29 incidents) and South Asian population (+11 incidents).
Chart 3 start
Data table for Chart 3
| Province | 2016 | 2017 | 2018 | 2019 |
|---|---|---|---|---|
| rate per 100,000 population | ||||
| CanadaData table for Chart 3Note 1 | 3.9 | 5.7 | 4.9 | 5.2 |
| N.L. | 0.4 | 0.4 | 0.4 | 1.1 |
| P.E.I. | 2.0 | 0.7 | 1.3 | 4.5 |
| N.S. | 2.2 | 2.2 | 3.3 | 3.3 |
| N.B. | 2.4 | 2.9 | 1.9 | 4.2 |
| Que. | 4.0 | 5.9 | 4.5 | 4.8 |
| Ont. | 4.4 | 7.3 | 5.7 | 5.9 |
| Man. | 2.8 | 2.7 | 3.1 | 4.1 |
| Sask. | 2.6 | 1.8 | 2.6 | 2.8 |
| Alta. | 3.3 | 4.5 | 5.7 | 4.7 |
| B.C. | 4.3 | 5.2 | 5.2 | 6.1 |
Source: Statistics Canada, Canadian Centre for Justice and Community Safety Statistics, Incident-based Uniform Crime Reporting Survey. |
||||
Chart 3 end
Census data show that diversity has increased in all provinces from 2011 to 2016 and that the largest proportion of individuals designated as visible minorities live in the three provinces of British Columbia, Ontario, and Alberta (Table 4).
Start of text box 3
Text box 3
Canada’s most diverse populations living in the three largest census
metropolitan areas
According to the 2016 Census, 22.3% of the Canadian population were a member of a visible minority group, compared to 19% in the 2011 National Household Survey. Canada’s visible minority population is most concentrated in the country’s three largest census metropolitan areas (CMAs)—Toronto, Montréal and Vancouver, home to 36% of the total Canadian population. Of the total visible minority population in Canada, 66% lived in one of these three CMAs in 2016. In that year, about 5 in 10 people residing in Toronto (51%) and Vancouver (49%) were visible minorities, whereas the same was true for 2 in 10 people residing in Montréal (23%). Forecasts indicate that by 2036, more than 6 in 10 individuals among the working-age population living in the CMAs of Toronto and Vancouver could be members of a visible minority. In Montréal, the proportion is expected to increase to more than 4 in 10 (Statistics Canada 2017a).
Canada’s three largest CMAs are also home to a great majority of Canadians who are members of religious groups that were most frequently targeted in religiously motivated hate crimes. For instance, in 2011, 1% of the Canadian population identified as Jewish, with most (82%) living in Toronto, Montréal or Vancouver. The majority (68%) of those identifying as Muslim, who made up 3% of the Canadian population, resided within Toronto, Montréal or Vancouver. Buddhists, Hindus and Sikhs represented 4% of the Canadian population, and the majority resided in the three largest CMAs (74%) (Statistics Canada 2013b). As with visible minority groups, these proportions are expected to increase over the next two decades (Statistics Canada 2017a; Statistics Canada 2010).
In 2016, same-sex couples (both married and common-law) accounted for 1% of all couples in Canada, rising 13% from 2011. Close to half (45%) of these couples resided in Toronto, Montréal, or Vancouver (Statistics Canada 2017b).
End of text box 3
Areas outside of CMAs posted larger increase in hate crimes than within CMAs
While the vast majority (84%) of police-reported hate crimes in Canada occurred in a census metropolitan area (CMA) in 2019 (Table 5),Note non-CMAs (smaller cities, small towns and rural areas) recorded an increase of 37% (86 more incidents), while CMAs recorded an increase of 3% (43 more incidents). For non-CMA areas, increases were reported in all provinces except for Alberta—which reported 2 fewer incidents in 2019 compared to 2018—this decline was largely the result of a large decrease reported by the Medicine Hat Police Service, which went from 18 incidents in 2018 to 2 incidents in 2019. British Columbia (+25 incidents) and New Brunswick (+13 incidents) had the largest provincial increases among non-CMA areas. Among the CMAs, larger increases were reported in Vancouver (+24 incidents) and Québec (+24 incidents), while decreases were found in Calgary (-37 incidents), Montréal (-27 incidents) and Kitchener-Cambridge-Waterloo (-24 incidents).
The increase in incidents outside CMAs was due to increases in both violent and non-violent hate crimes, including general mischief (+28 incidents), common assault (+14 incidents) and public incitement of hatred (+14 incidents). In addition, there were more incidents targeting race or ethnicity (+44 incidents) and sexual orientation (+27 incidents).
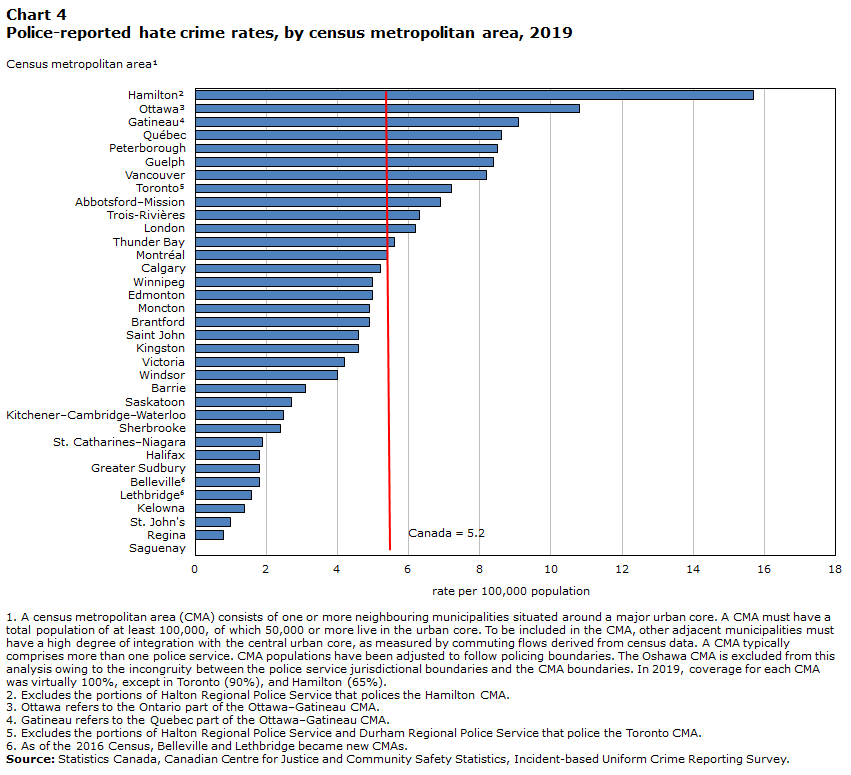
Overall, 66% of hate crimes occurred in 8 CMAs each reporting 70 or more incidents in 2019. Most of these incidents were reported in four of the largest CMAs (Toronto, Montréal, Vancouver and Ottawa). These four CMAs accounted for 51% of all hate crimes, but were home to 37% of Canada’s population. Additionally, these CMAs are home to the largest concentration of population groups designated as visible minorities (see Text box 3).Note
Nationally, 19 of 35Note CMAs reported increases in hate crimes from 2018 to 2019, and another 5 CMAs reported no change year-over-year. When controlling for the size of the population of each CMA, the CMAs with the highest rates of police-reported hate crime were Hamilton (15.7 hate crimes per 100,000 population), Ottawa (10.8 hate crimes per 100,000 population) and Gatineau (9.1 hate crimes per 100,000 population) (Chart 4).Note
Chart 4 start
Data table for Chart 4
| Census metropolitan areaData table for Chart 4Note 1 | Rate - 2019 |
|---|---|
| rate per 100,000 population | |
| HamiltonData table for Chart 4Note 2 | 15.7 |
| OttawaData table for Chart 4Note 3 | 10.8 |
| GatineauData table for Chart 4Note 4 | 9.1 |
| Québec | 8.6 |
| Peterborough | 8.5 |
| Guelph | 8.4 |
| Vancouver | 8.2 |
| TorontoData table for Chart 4Note 5 | 7.2 |
| Abbotsford–Mission | 6.9 |
| Trois-Rivières | 6.3 |
| London | 6.2 |
| Thunder Bay | 5.6 |
| Montréal | 5.4 |
| Calgary | 5.2 |
| Winnipeg | 5.0 |
| Edmonton | 5.0 |
| Moncton | 4.9 |
| Brantford | 4.9 |
| Saint John | 4.6 |
| Kingston | 4.6 |
| Victoria | 4.2 |
| Windsor | 4.0 |
| Barrie | 3.1 |
| Saskatoon | 2.7 |
| Kitchener–Cambridge–Waterloo | 2.5 |
| Sherbrooke | 2.4 |
| St. Catharines–Niagara | 1.9 |
| Halifax | 1.8 |
| Greater Sudbury | 1.8 |
| BellevilleData table for Chart 4Note 6 | 1.8 |
| LethbridgeData table for Chart 4Note 6 | 1.6 |
| Kelowna | 1.4 |
| St. John's | 1.0 |
| Regina | 0.8 |
| Saguenay | 0.0 |
| Canada | 5.2 |
|
|
Chart 4 end
It is important to note that the number of police-reported hate crimes among individual CMAs can be relatively small and are sensitive to fluctuations. Therefore, these data are highly variable according to policing practices, shifting attitudes and reporting practices among the public. For example, some local police services, especially those serving large cities, have dedicated hate crime units or allow for online reporting. Additionally, many cities have local anti-racism or anti-hate committees that work with police to address issues of hate in their communities (see Text box 4). These practices may influence the likelihood that a hate crime is reported to police.
Police-reported hate crimes motivated by hatred of a race or ethnicity increased
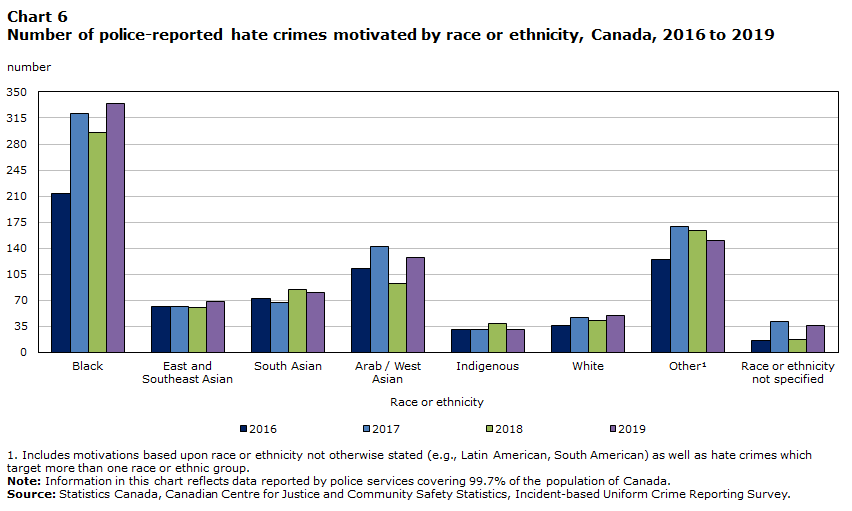
Police reported 876 criminal incidents motivated by hatred of race or ethnicity, up 10% from the previous year (Table 1; Chart 5). This increase was predominantly the result of 40 more hate crimes targeting the Black population (+14%) and 35 more incidents targeting the Arab or West Asian population (+38%) (Table 1; Chart 6). Overall, 46% of all police-reported hate crime was motivated by hatred of a race or ethnicity. This proportion is similar to the previous four years, where hate crime motivated by hatred of a race or ethnicity accounted for between 43% and 48% of all hate crime.
Chart 5 start
Data table for Chart 5
| Type of motivation | 2016 | 2017 | 2018 | 2019 |
|---|---|---|---|---|
| number | ||||
| Race or ethnicity | 666 | 878 | 793 | 876 |
| Religion | 460 | 842 | 657 | 608 |
| Sexual orientation | 176 | 204 | 186 | 263 |
| Sex or gender | 24 | 32 | 54 | 53 |
| Other motivationData table for Chart 5Note 1 | 64 | 85 | 105 | 99 |
Source: Statistics Canada, Canadian Centre for Justice and Community Safety Statistics, Incident-based Uniform Crime Reporting Survey. |
||||
Chart 5 end
Chart 6 start
Data table for Chart 6
| Race or ethnicity | 2016 | 2017 | 2018 | 2019 |
|---|---|---|---|---|
| number | ||||
| Black | 214 | 321 | 295 | 335 |
| East and Southeast Asian | 61 | 61 | 60 | 68 |
| South Asian | 72 | 67 | 84 | 80 |
| Arab / West Asian | 112 | 142 | 93 | 128 |
| Indigenous | 30 | 31 | 39 | 30 |
| White | 36 | 46 | 42 | 49 |
| OtherData table for Chart 6Note 1 | 125 | 169 | 163 | 150 |
| Race or ethnicity not specified | 16 | 41 | 17 | 36 |
Source: Statistics Canada, Canadian Centre for Justice and Community Safety Statistics, Incident-based Uniform Crime Reporting Survey. |
||||
Chart 6 end
In 2019, police in Canada reported 335 incidents motivated by hatred against the Black population, the highest number recorded dating back to 2009. This represented 38% of all hate crimes targeting race or ethnicity, and 18% of all hate crimes in 2019. There were approximately 28.0 incidents per 100,000 members of the Black population.Note The Black population was the most commonly targeted group overall for 2019. Historically, the Black, Jewish and Muslim populations have been the most targeted groups. Ontario (+29 incidents) and British Columbia (+16 incidents) accounted for the largest increase in crimes against the Black population, while Alberta (-19 incidents) recorded the largest decrease.
Second highest recorded number of hate crimes against the Arab or West Asian population
In 2019, there were 128 hate crimes specifically targeting the Arab or West Asian population. This represents approximately 16.2 crimes per 100,000 members of the Arab or West Asian population in Canada.Note
The number of police-reported hate crimes against the Arab or West Asian population rose 38% to the second highest number dating back to 2009, following a 35% decrease a year earlier. From 2018 to 2019, the number of hate crimes targeting the Arab or West Asian population increased from 93 to 128 incidents. These crimes accounted for 15% of hate crimes targeting a race or ethnicity, and 7% of all hate crimes in 2019 (Table 1).
Quebec reported 19 more hate crimes targeting the Arab or West Asian population (40 incidents in 2018 to 59 incidents in 2019) and British Columbia reported 7 more (8 in 2018 to 15 in 2019).
The number of hate crimes targeting the East or Southeast Asian populationNote increased from 60 in 2018 to 68 in 2019, accounting for 4% of all hate crimes. This proportion has remained relatively stable (between 3% and 4%) over the last five years. Similarly, while hate crimes targeting the South Asian populationNote decreased from 84 in 2018 to 80 in 2019, they accounted for 4% of all hate crimes. There were approximately 2.3 and 4.2 police-reported hate crimes per 100,000 members of the East or Southeast Asian population and the South Asian population, respectively.Note
While these data cover incidents reported to police in 2019, there have been indications of heightened levels of discriminatory behaviours targeting the Asian community in the context of the COVID-19 pandemic. According to media outlets and police reports, since the onset of the COVID-19 pandemic in 2020, more than 600 anti-Asian incidents have been reported across seven provinces, and in Vancouver specifically, anti-Asian hate crime incidents have increased 878% compared to 2019 (Kotyk 2020; Xu 2020). Additionally, as part of Statistics Canada’s effort to provide insights into the social and economic impacts of the pandemic, a crowdsourcing survey was conducted to measure perceptions of personal safety during the pandemic among population groups designated as visible minorities (Heidinger and Cotter 2020). The proportion of visible minority participants who perceived an increase in the frequency of harassment or attacks based on race, ethnicity or skin colour was three times larger than the proportion among the rest of the population since the start of the COVID-19 pandemic (18% compared with 6%). This difference was most pronounced among Chinese (30%), Korean (27%), and Southeast Asian (19%) participants. It should be noted that the methodology used for this study was not designed using a probabilistic sampling method, therefore we cannot make an inference about these results for the overall Canadian population.
Hate crimes against Indigenous peoples continue to account for relatively few police-reported hate crimes
Feelings of safety and public perceptions of institutions like the police and the criminal justice system can impact the willingness of particular communities to report incidents to the police. According to data from the General Social Survey (GSS), Indigenous peoples (30%) are less likely to report having a great deal of confidence in the police compared to their non-Indigenous counterparts (42%) (Ibrahim 2020; Cotter 2015). Furthermore, according to the GSS, Indigenous victims of non-spousal violence were more likely not to report the crime to police than their non-Indigenous counterparts (Boyce 2016).
Poor relations between the police and Indigenous and racialized peoples in Canada are well documented (Ben-Porat 2008; Brown and Benedict 2002; Chan and Mirchandani 2002; Council of Canadian Academies 2019; Ibrahim 2020; Jones et al. 2014; Nilson and Mantello 2019; Selkirk 2020). The relationship between Indigenous peoples and the police has been described as one of mistrust. This characterization is rooted in a history of colonization, including residential schools (the last of which closed in 1996) and forced relocation, and is recognized for having profoundly impacted Indigenous communities and families (Bombay et al. 2014; Bombay et al. 2011; Bombay et al. 2009; The Truth and Reconciliation Commission of Canada 2015). The Truth and Reconciliation Commission, for example, has described how the involvement of police in the residential school system has impacted Indigenous peoples and their trust in police (Truth and Reconciliation Commission of Canada 2015). In addition, The Final Report of the National Inquiry into Missing and Murdered Indigenous Women and Girls presents other recent evidence of how historical events and systemic responses to missing and murdered Indigenous women and girls directly contribute to the lack of trust in police among Indigenous peoples (MMIWG 2019). Indigenous peoples often experience social and institutional marginalization, discrimination, and various forms of trauma and violence, including intergenerational trauma and gender-based violence (Arriagada et al. 2020; MMIWG 2019; Statistics Canada 2020; The Truth and Reconciliation Commission of Canada 2015).
Bearing in mind these systemic issues, the number of police-reported hate crimes targeting Indigenous populations decreased from 39 in 2018 to 30 in 2019. Police-reported hate crime incidents targeting Indigenous peoples – including those who are First Nations, Métis, or Inuit – account for a relatively small proportion of police-reported hate crimes (2%) (Table 1). This represented a rate of 1.8 hate crimes per 100,000 Indigenous people in Canada in 2019.Note
Start of text box 4
Text box 4
Initiatives to address and prevent hate crime in Canada
In an effort to address and prevent hate crime, as well as provide reporting alternatives other than police, a number of governmental and non-governmental initiatives have been developed. These initiatives range from federal action plans, to community-based outreach by police, to creating websites for people to report hate crimes and non-criminal hate incidents online. These practices may influence the likelihood that a hate crime is reported to police.
In an effort to combat racism and discrimination, the Government of Canada funded Building a Foundation for Change: Canada’s Anti-Racism Strategy 2019-2022 (Canadian Heritage 2019). Part of the Anti-Racism Strategy involves the creation of an Anti-Racism Secretariat to coordinate federal action and engage with relevant communities, experts and stakeholders.
Many of the police services that serve large cities, such as Edmonton, Toronto and Vancouver have specialized hate crime units. These units are composed of officers and/or civilians that have specific training in crimes motivated by hate. Specialized hate crime units help to provide support to front line officers, conduct hate crime specific investigative work, educate other police officers and the community, and provide outreach to affected communities (Edmonton Police Service 2018; York Regional Police 2018; CBC News 2020). Alongside the hate crime units, some police services, such as the Ottawa Police Service, allow hate crimes to be reported online, while other police services, such as the Service de police de la Ville de Montréal, allow non-criminal hate incidents to be reported online.
Many cities also have local anti-racism or anti-hate committees that work with police to address issues of hate in their communities. These include, for example, the Thunder Bay Anti-Racism and Respect Advisory Committee, the Hamilton Committee against Racism, and the Peterborough Community Race Relations Committee. These groups may also help encourage the reporting of hate crime.
Non-governmental organizations (NGOs) play a role in addressing and preventing hate crime. Organizations such as the Alberta Hate Crimes Committee, and Stop Racism and Hate Canada have spaces on their websites for the public to report hate incidents including both actual crimes and non-criminal incidents that involve bias or prejudice.Note NGOs also raise awareness by providing online educational courses for secondary school students and workshops for professionals to teach about multiculturalism and human rights in Canada and how to work positively in a multicultural environment. Through Public Safety Canada’s Community Resilience Fund (administered through the Canada Centre for Community Engagement and Prevention of Violence, the fund is used to support initiatives that aim to prevent radicalization to violence in Canada), the YWCA Canada is developing the Block hate: Building resilience against online hate speech. This project will examine hate speech trends across Canada and work with experts to develop online tools and digital literacy training for young Canadians across ten communities (Public Safety Canada 2020).
In response to reported increases in incidents of discrimination during the COVID-19 pandemic, various Canadian organizations have developed initiatives to report incidents of discrimination and collect information for specific groups. For example, “Project 1907” and “Fight COVID Racism” have created centralized online tools for reporting incidents of anti-Asian discrimination (Project 1907 2020; Fight COVID Racism 2020). Additionally, Ryerson University has developed a “Responding to Hate Toolkit”, providing information on the difference between hate crimes, hate incidents and acts of discrimination, as well as resources to report and respond to these incidents (Ryerson 2020).
End of text box 4
Decrease in the number of crimes targeting a religious group for the second year in a row
According to the 2011 National Household Survey, the increased ethno-cultural diversity in Canada has been paralleled by an increase in the proportion of people who reported religious affiliations other than Christianity. In 2011, 7.2% of the Canadian population reported that they identify as Muslim, Hindu, Sikh or Buddhist, compared to 4.9% in 2001 (Statistics Canada 2013b; Table 4). The Jewish population has remained stable at 1%. Two-thirds (67.3%) of the Canadian population reported affiliation with a Christian religion. Almost one-quarter (23.9%) of Canadians reported no religious affiliation, compared to 16.5% in 2001.
The majority of Canadians who reported non-Christian religions were also members of a visible minority group, with one exception. The exception was for those who were Jewish, among whom 2% were members of a visible minority group. In 2011, 88% of Muslims and 97% of Buddhists, Hindus and Sikhs residing in Canada were also members of a visible minority group (Statistics Canada 2013b).Note The overlap between race or ethnicity and religion may have an impact on hate crime statistics, as some religious populations or communities may also be targeted in hate crimes motivated by race or ethnicity. When a hate crime incident involves or appears to involve more than one motivation (e.g., religion and race or ethnicity), the incident is reported by the police only once according to the primary motivation determined by the circumstances of the incident.
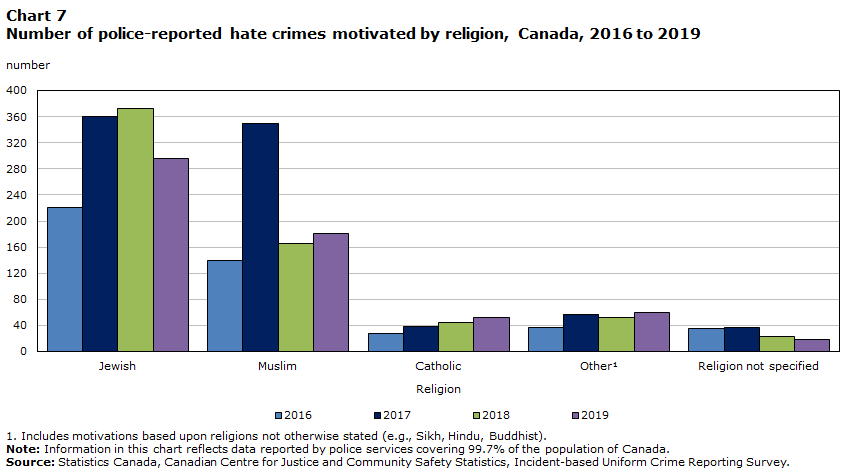
In 2019, 608 hate crimes targeting religion were reported by police, a decrease of 7% compared with 2018 (Table 1; Chart 5). This is the second consecutive year-over-year decrease, following a peak of 842 incidents in 2017, yet the number remains higher than those recorded prior to 2017. Among reported hate crimes targeting a religion in 2019, the Jewish and Muslim populations continue to be the most frequent targets, accounting for 49% and 30% of crimes against a religion, respectively.
Following a large decrease in hate crimes against the Muslim population in 2018, police reported 15 more incidents in 2019, for a total of 181 (+9%) (Chart 7). The increase in police-reported hate crimes against Muslims was largely the result of an increase in Quebec (+15 incidents).
Chart 7 start
Data table for Chart 7
| Religion | 2016 | 2017 | 2018 | 2019 |
|---|---|---|---|---|
| number | ||||
| Jewish | 221 | 360 | 372 | 296 |
| Muslim | 139 | 349 | 166 | 181 |
| Catholic | 27 | 39 | 44 | 52 |
| OtherData table for Chart 7Note 1 | 37 | 57 | 52 | 60 |
| Religion not specified | 36 | 37 | 23 | 19 |
Source: Statistics Canada, Canadian Centre for Justice and Community Safety Statistics, Incident-based Uniform Crime Reporting Survey. |
||||
Chart 7 end
In contrast, following a 63% jump in 2017 and a 3% increase in 2018, the number of incidents targeting the Jewish population decreased 20% in 2019, from 372 to 296. The decline was the result of fairly widespread decreases, including fewer incidents in Alberta (-29), British Columbia (-20), Ontario (-19) and Quebec (-18).
While police-reported metrics indicate a decrease in hate crimes targeting religion, the General Social Survey on Victimization has shown that people affiliated with a non-Christian religion are significantly more likely to report experiencing discrimination on the basis of their religion in the five years preceding the survey than Christians (11% compared to 1%) (Ibrahim 2018). Furthermore, in its 2019 annual audit of anti-Semitic incidents, B’Nai Brith reported a record number of anti-Semitic incidents it had tracked for the fourth consecutive year (B’nai Brith Canada 2020).
Increase in crimes that are motivated by hatred of a sexual orientation
Sexual orientation refers to a person’s physical, romantic, emotional or sexual attraction. This attraction can be to someone of a different gender, the same gender, no gender, or more than one gender. In the police reported data, a hate crime can be reported as being motivated by the hatred of heterosexual, lesbian or gay, bisexual, or any other sexual orientation. This category does not include crimes motivated by hatred targeting the transgender population, as those are collected under the category of sex or gender identity. That being said, some victims of hate crimes based on sexual orientation may be transgender individuals targeted because of their perceived sexual orientation.
In 2019, police reported 263 hate crimes targeting sexual orientation, a 41% increase compared to the previous year. This is the highest recorded number of these incidents going back to 2009 (Table 1). The increase was primarily attributable to the province of Ontario, which saw 35 more incidents in 2019. It should be noted that this increase follows a similarly large decrease in 2018. Alberta (+16 incidents) and British Columbia (+7 incidents) also reported more incidents in 2019, each increasing for the second consecutive year (Table 3).
Crimes motivated by hatred of a sexual orientation made up 14% of all police-reported hate crimes in 2019. The large majority (88%) of these crimes specifically targeted the gay and lesbian community. This proportion, however, has been trending down since 2010, with a peak of 94% in 2013.
Police-reported hate crimes motivated by hatred of a gender expression or identity
From 2010 to 2019, 55 hate crimes targeting gender diverse people were reported by police. The majority (39 incidents) of these crimes have occurred in the last three years (15 incidents in 2017, 13 in 2018 and 11 in 2019). Even though the overall number is small relative to other hate crimes, incidents targeting gender diverse people were more often violent in nature, with 80% of incidents involving a violent violation.
Over the same 10 year time period, 63 hate crimes targeting females were reported by police, again with the majority (44 incidents) occurring in the last three years, and the majority (63%) of these incidents being violent in nature.
Start of text box 5
Text box 5
Discrimination based on gender identity, gender expression or sexual
orientation
In June 2017 “An Act to amend the Canadian Human Rights Act and the Criminal Code” received royal assent. The Act formally recognizes protection for gender expression and identity under the Canadian Human Rights Act and the Criminal Code of Canada by codifying it in a list of identifiable groups that are protected from discrimination. Also included in that list are groups identifiable by colour, race, religion, national or ethnic origin, age, sex, sexual orientation, or mental or physical disability.
To date, there have been relatively few police-reported incidents of hate crimes targeting sex or gender, while those targeting sexual orientation appear to be trending up. Research suggests, however, that discrimination and violence toward individuals based on their gender or sexual orientation is widespread (Burczycka 2020; Cotter and Savage 2019; Jaffray 2020; Simpson 2018b). According to the latest Survey of Safety in Public and Private Spaces (SSPPS), an estimated 1 million people in Canada are sexual minorities—that is, they reported their sexual orientation as gay, lesbian, bisexual or a sexual orientation that is not heterosexual—and an estimated 75,000 are transgender (Jaffray 2020).
The issues of discrimination against gender identity and sexual orientation are of great importance, with specific government programs set up to fund research into strategies to combat discrimination and encourage equality. For example, the Government of Canada launched the LGBTQ2 community capacity fund, an effort to advance LGBTQ2 equality across Canada (Status of Women Canada 2020a). As well, Canada’s gender-based violence strategy, It’s Time: Canada’s strategy to prevent and address gender-based violence, is an effort to achieve gender equality and eradicate gender-based violence through various initiatives to bolster research and policy, prevent violence and support survivors (Status of Women Canada 2020b).
Some gender-motivated crimes have more recently been linked to the emergence of the “incel” community and its ideology. Involuntary celibates (incels) are men who define themselves by their inability to form or access sexual relationships with women. They believe this is the combined result of genetic factors, evolutionarily determined traits in women, and inequitable social structures. The majority of the incel community exists through online interaction in chat rooms and message boards. While acts of violence are not a defining quality, there is an overarching theme among the incel community that violence toward women is a viable option, and large-scale acts of violence are often celebrated or revered by the community. There is also some intersection between incel ideology and violent far-right extremist ideologies (Public Safety Canada 2020).
End of text box 5
One-third of hate crimes were cleared
In 2019, one third (33%) of hate crime incidents were cleared (meaning solved). Specifically, of the incidents that were cleared, 73% resulted in charges laid against one or more individuals, and 27% were cleared otherwise, meaning an accused was identified but a charge was not laid. As has historically been the case, in most incidents cleared otherwise in 2019, charges were not laid due to departmental discretion – meaning that in some cases the accused received a warning or caution (43%) or the complainant declined to proceed with charges (32%). The clearance rate for non-violent hate crimes was far lower than the rate for violent hate crimes (16% versus 53%). This is primarily due to very low clearance rates for mischief in general, where it is difficult to identify a perpetrator. In addition, incidents that involve a youth may be dealt with through diversionary programs or when a charge is laid, cases may not flow through the traditional court system if a victim sought resolution through restorative justice or other alternative measures, or if the Crown determines there is insufficient evidence to proceed with a case in court.
For hate-motivated mischief incidents in 2019, the most common type of non-violent hate crime, 10% were cleared compared to 24% of non-hate motivated mischief. Of these cleared incidents, 75% resulted in the laying of charges in hate-motivated mischief, a larger proportion compared to the 24% of non-hate motivated mischief.
Similarly, for common assault (historically one of the most frequent types of violent hate crime), clearance rates were lower for hate-motivated assaults (56%) compared to non-hate motivated common assaults (67%). Moreover, of those cleared incidents, 74% of hate-motivated common assaults were cleared by charge, compared to 69% of non-hate motivated incidents of common assault.
Given the annual counts of hate-motivated crimes can be relatively small, the following sections on police-reported hate crime are based on detailed incidents from 2010 to 2019 in order to provide information on the characteristics of incidents, victims and accused persons.
Police-reported hate crime targeting sexual orientation, the South Asian, the Arab or West Asian, and the East and Southeast Asian populations was more often violent
While the large majority (78% in 2019) of police-reported crime (excluding traffic offences) is non-violent in nature, hate crimes targeting specific population groups were more likely to be violent (Moreau 2020). Specifically, between 2010 and 2019, the majority of police-reported hate crimes targeting the South Asian (65%), the Arab or West Asian (65%), the East and Southeast Asian (57%) populations were violent compared to those targeting other ethnocultural groups. As well, most hate crimes motivated by a person’s sexual orientation were violent (62%). The proportions of violent crimes targeting these populations were similar, with common assault occurring most often (between 22% and 28% of all hate crimes), followed by uttering threats (12% to 19%) and assault with a weapon or causing bodily harm (6% to 10%).
Despite relatively few incidents during that same time frame, those targeting the Indigenous population (51%) and people with disabilities (69%) were also more likely to be violent than not. The 2017 Canadian Survey on Disability (CSD)Note found that just over one in five (22%) Canadians aged 15 and older had at least one disability (Morris et al. 2018). Research to date has found that having a disability, and the severity of the disability, are linked to lower levels of employment and higher levels of poverty and victimization (Cotter 2018; Morris et al. 2018). A recent analysis of self-reported data on violent victimization found that women with a disability were twice as likely to be victims of violent crime (137 incidents per 1,000 women with a disability versus 65 incidents per 1,000 women without a disability), and are more likely to experience repeated violence over a 12-month period, than women who do not have a disability (Cotter 2018).
Notably, mischief (which includes graffiti) accounted for the largest proportion of hate crime violations in 2019 (45%). Mischief may be especially impacted by greater variation in reporting to the police from different populations, thus it can affect the proportion of hate crime motivations reported for non-violent crimes versus violent crimes. For example, 61% of police-reported hate crimes targeting religion were mischief, compared to 37% targeting race or ethnicity.
Police-reported hate crime targeting the Black population and religion more often non-violent
Of all police-reported hate crimes targeting the Black population between 2010 and 2019, 59% were non-violent. A significant portion (84%) of these non-violent crimes were general mischief, while the most common violent offence was common assault (38%).
During the same period, 84% of crimes against the Jewish population were non-violent. The large majority of the non-violent hate crimes were general mischief (81%), as well as hate-motivated mischief relating to property primarily used for religious worship or by an identifiable group (8%). The most common violent offence against this population was uttering threats (42% of violent offences and 7% of all offences targeting the Jewish population).
From 2010 to 2019, 58% of crimes against the Muslim population were non-violent while the other 42% were violent. The most common non-violent hate crime was general mischief (57% of non-violent offences), while the most common violent hate crimes targeting Muslims were uttering threats (42%) and common assault (25%).
Start of text box 6
Text box 6
Hate crime and extremism
Both hate crime and right-wing extremism are motivated by intense hate of perceived or real differences between themselves and others, be it race, religion, gender, sexual orientation, or other identity (Perry and Scrivens 2017; Stevkovski 2015). Unlike hate crime, there is no Criminal Code definition of extremism. Public Safety Canada defines violent extremism as “a term describing the beliefs and actions of people who support or use violence to achieve extreme ideological, religious or political goals” (Public Safety Canada 2018a). According to recent Canadian research, there are at minimum 130 active right-wing extremist groups across Canada (Perry and Scrivens 2016). Furthermore, the Institute for Strategic Dialogue has linked more than 6,600 right-wing extremism social media accounts and channels in Canada (Davey et al. 2020).
In 2020, Facebook Canada and the Ontario Tech University’s Centre on Hate, Bias and Extremism partnered to create the “Global Network Against Hate” (Ontario Tech University 2020). This initiative is meant to develop strategies, policies and tools to identify and combat hate and extremism, especially online.
Additionally, in December 2018, the Government of Canada’s National Strategy on Countering Radicalization to Violence articulates an approach toward preventing and countering expressions of intolerance, hate, and violent extremism in the public and online spheres (Public Safety Canada 2018b). Part of this approach involves funding initiatives that aim to prevent radicalization to violence in Canada.
One such initiative is the “Canada Redirect” project, with partnership from the company Moonshot CVE (Countering Violent Extremism). The objective of the project is to help counter radicalization and provide positive alternative content to anyone searching online for extremist topics and who may be vulnerable to radicalizationNote (Public Safety Canada 2018b). Most recently, Moonshot CVE released findings from a review of internet search engine traffic at the outset of the COVID-19 pandemic. The review indicated that on average, weekly searches for violent far-right keywords have increased since the beginning of the pandemic across six Canadian cities by an average of 18.5% (Moonshot CVE 2020).
End of text box 6
Police-reported violent hate crimes against Indigenous and Muslim populations more likely than other hate crimes to involve female victims
For all types of hate crimes reported to police between 2010 and 2019, almost 7 in 10 victims were male and nearly a third (32%) were female. While males accounted for the majority of victims in all types of hate crimes, a higher proportion of male victims (80%) were identified among police-reported hate crime targeting sexual orientation.
Violent incidents targeting the Muslim and Indigenous populations were more likely than other types of hate crimes to involve female victims. Of all victims of violent crimes targeting the Muslim population that were reported to police, 47% were women or girls, while this was the case for 45% of victims of hate crimes against the Indigenous population (Table 6).
Of note, the relatively high proportion of female victims of hate crimes targeting Muslim and Indigenous populations could be related to specific factors. For example, the practice of wearing head coverings may make religious identity more visible for Muslim women than for men (National Council of Canadian Muslims 2014; National Council of Canadian Muslims 2017). Additionally, the overrepresentation of Indigenous persons as victims of violence has been documented in previous research (Boyce 2016; Miladinovic and Mulligan 2015; Perreault 2015; Scrim 2009). According to the GSS, after controlling for other risk factors such as younger age, lower education and higher unemployment, Indigenous women are overall at greater risk of violent victimization (Perreault 2015).
Hate crimes typically occur in open areas and at residences
From 2010 to 2019, hate crimes most often occurred in open areas or at residences. Specifically, violent hate crimes occurred most frequently in open areas like on the street or in parks or fields (33%), at residences (26%) and at commercial businesses (18%) (Table 7). These proportions were similar for violent offences targeting race or ethnicity, although those targeting Indigenous (49%), South Asian (43%) and East or Southeast Asian (42%) populations were more likely to occur in open areas.
Violent hate crimes targeting religion were the most likely type to occur in religious institutions (12% occurred in religious institutions), while incidents targeting the Muslim population (28%) were more likely to occur in an open area compared to those targeting the Jewish population (18%).
Non-violent hate crimes most often occurred in open areas (29%), or at residences (25%), educational institutions (15%) and commercial businesses (13%). Compared to violent hate crimes, non-violent hate crimes targeting race or ethnicity, and religion, which are largely mischief offences, occurred more often at educational and religious institutions. For instance, 16% of non-violent hate crimes targeting race or ethnicity occurred at an educational institution, compared to 7% of violent hate crimes (Table 7). For non-violent hate crimes targeting religion, 21% occurred at religious institutions, 14% at educational institutions and 10% at commercial businesses. In contrast, non-violent hate crimes targeting sexual orientation occurred far more often at a residence (38%) than anywhere else.
Uttering threats the most common type of cyber hate crime
The internet provides a platform for equal communication of beliefs and opinions by all users. It also offers a medium for the spread of hate-related content targeting various groups. According to data from the GSS, 30% of internet users aged 15 to 24 came across hate content while on the internet, with ethnic and religious minorities the most commonly targeted (Perreault, 2013). The Government of Canada recently announced Canada’s Digital Charter, which outlines ten guiding principles under which the public can expect to interact with digital content or platforms (Government of Canada 2019). One of these principles includes being free from hate and violent extremism. The Digital Charter states that Canadians can expect that digital platforms will not foster or disseminate hate, violent extremism or criminal content.
From 2018 to 2019, the proportion of police-reported hate crime incidents that were also recorded by police as cybercrimes increased from 5.1% to 6.2%. The year over year increase was primarily due to more incidents of indecent or harassing communications, and uttering threats.
Of the 572 hate crimes that were also recorded by police as cybercrimes between 2010 and 2019, these most commonly targeted the Muslim population (17%), the Jewish population (13%), a sexual orientation (13%) and the Black population (10%).Note Note Over the same 10 year period, uttering threats (38%) was by far the most common type of hate-motivated cybercrime, followed by public incitement of hatred (17%), indecent or harassing communications (17%), and criminal harassment (12%). In comparison, these offences accounted for a smaller proportion of non-cyber hate crimes.
Victims of police-reported violent hate crimes targeting sexual orientation and the Indigenous population are the youngest and have highest percentage of injury
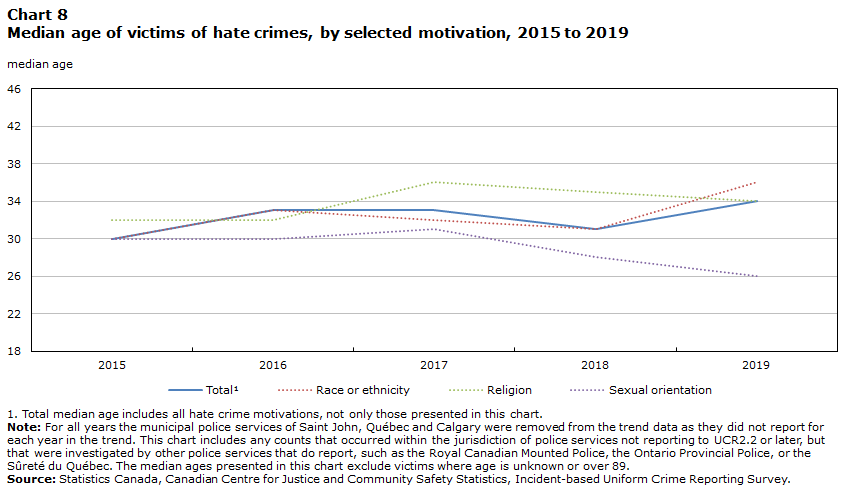
From 2010 to 2019, victims of violent hate crime where their (perceived) sexual orientation was targeted (median age of 27 years) and victims identified as Indigenous (median age of 28 years) tend to be the youngest (Table 6). According to police-reported data for violent hate-motivated incidents, the median age of all victims was 31 years. The median age for victims of violent crimes targeting religion was relatively high at 37 years (Chart 8).
Chart 8 start
Data table for Chart 8
| Year | TotalData table for Chart 8Note 1 | Race or ethnicity | Religion | Sexual orientation |
|---|---|---|---|---|
| median age | ||||
| 2015 | 30 | 30 | 32 | 30 |
| 2016 | 33 | 33 | 32 | 30 |
| 2017 | 33 | 32 | 36 | 31 |
| 2018 | 31 | 31 | 35 | 28 |
| 2019 | 34 | 36 | 34 | 26 |
Source: Statistics Canada, Canadian Centre for Justice and Community Safety Statistics, Incident-based Uniform Crime Reporting Survey. |
||||
Chart 8 end
Victims of violent hate crimes targeting sexual orientation and Indigenous peoples were also the most likely to have sustained injury. Between 2010 and 2019, 44% of victims of violent hate crimes targeting Indigenous peoples and 41% of those targeting sexual orientation, sustained injuries as a result of the incident (Table 6). Overall, victims of violent hate crimes targeting race/ethnicity were more likely to have resulted in injuries than crimes targeting religion.
Victims of police-reported violent hate crimes targeting East and Southeast Asian population and the Muslim population more often to be victimized by strangers
The majority (63%) of hate crime victims were victimized by a stranger, with victims of the East and Southeast Asian population (82%) and the Muslim population (79%) most likely to be victimized by a stranger (Table 6). Compared to other types of hate crime victims, the prevalence of victimization by someone known to them was highest among victims of hate crimes targeting the Black population (43%) and those targeted because of their perceived sexual orientation (43%). Very few (4%) hate crime victims were victimized by a family member or intimate partner, compared to an acquaintance (33%) or a stranger (63%).
Persons accused of hate crimes tend to be male and younger
Like crime in general, the vast majority of persons accused of hate crime tend to be young males (Table 8). Overall, from 2010 to 2019, 84% of persons accused of hate crime targeting race/ethnicity were male, as were 89% of those targeting religion and 90% targeting sexual orientation. The median age for persons accused of hate crime was 28, with persons accused of hate crimes against the Muslim and Arab or West Asian populations tending to be oldest (44 and 36 years of age, respectively).
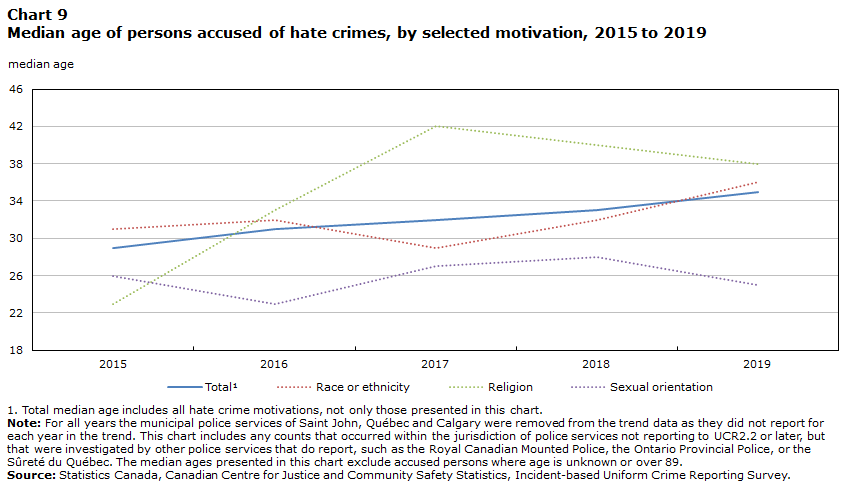
Additionally, when looking the five year trend from 2015 to 2019, the median age of those accused of hate crime has been trending up, from a low of 29 in 2015 to a high of 35 in 2019 (Chart 9). Similar to victims of hate crime, the median age of those accused of hate crimes targeting religion tends to be much older, while the median age of those accused of hate crimes targeting sexual orientation tends to be younger (Chart 9).
Chart 9 start
Data table for Chart 9
| Year | TotalData table for Chart 9Note 1 | Race or ethnicity | Religion | Sexual orientation |
|---|---|---|---|---|
| median age | ||||
| 2015 | 29 | 31 | 23 | 26 |
| 2016 | 31 | 32 | 33 | 23 |
| 2017 | 32 | 29 | 42 | 27 |
| 2018 | 33 | 32 | 40 | 28 |
| 2019 | 35 | 36 | 38 | 25 |
Source: Statistics Canada, Canadian Centre for Justice and Community Safety Statistics, Incident-based Uniform Crime Reporting Survey. |
||||
Chart 9 end
Between 2010 and 2019, youth aged 12 to 17 made up 23% of all persons accused of hate crime. Similar to all hate crimes, the vast majority of youth accused of hate crime were male (86%). Over half (54%) of the youth accused of hate crimes targeted race or ethnicity, followed by 20% targeting religion and 19% targeting sexual orientation, which was virtually identical to the distribution seen in adults accused of hate crimes.
Criminal justice processing of hate-motivated criminal incidents
Effectively countering hate crimes and responding to victims requires a multifaceted approach. This approach can include protection, prevention, community partnerships, the effective use of law enforcement and the criminal justice system, and the use of administrative and civil justice systems for effective remedies (Canadian Race Relations Foundation 2020; Office for Democratic Institutions and Human Rights 2020). The prosecution of crimes as motivated by hate can be complex from a legal standpoint; while any criminal incident has the potential to be motivated by hate, it can be difficult to prove motivation beyond a reasonable doubt in court. Additionally, the prosecution of hate crimes involving hate-motivated language can be difficult due to provisions regarding protected speech. Ultimately, while police may classify a crime as hate-motivated, this may only be considered by a court as an aggravating factor at the time of sentencing. The only exception to this being those Criminal Code offences that are specifically hate crimes.
A recent study of case law by Justice Canada found that from 2007 to 2019, 48 published case decisions considered hate motivation at the time of sentencing (Provost-Yombo et al. 2021). In those decisions, the most frequent grounds presented for hate-motivated crimes were race, nationality, ethnicity and religion. Compared to case law from 1996 to 2007, there was an increase in the number of cases dealing with hate crimes committed on the grounds of sex (specifically targeting females). Sentence lengths were increased by an average of approximately 70% in cases where courts made the finding that hate was an aggravating factor.
In order to shed some more light on court and sentencing outcomes for incidents recorded by police as motivated by hate, UCR incidents from 2013 to 2018 were linked to court records (see Survey description). This permitted a descriptive profile of how police-reported hate crime incidents progress once they come before the courts, regardless of whether hate as a motivating factor was considered in sentencing.Note
From 2013 to 2018, 1,528 police-reported hate crime incidents were identified as in-scope to be linked to records from the Integrated Criminal Court Survey (ICCS), out of a possible 8,538 hate crime incidents.Note The ICCS represents completed adult criminal and youth court charges from 2012/2013 to 2018/2019.Note In total, 948 hate crime incidents were successfully linked to 1,033 completed court cases.Note Note Some police-reported incidents linked to multiple charges or cases, particularly in the event that there were multiple accused persons associated with the incident. The 1,033 linked cases involved 4,551 charges, or an average of 4 charges per case. The median length of time it took to complete a case was 175 days.Note In contrast, the median length of time to complete an adult criminal court case overall during this time was 128 days.Note
Majority of hate-motivated crimes do not enter criminal court
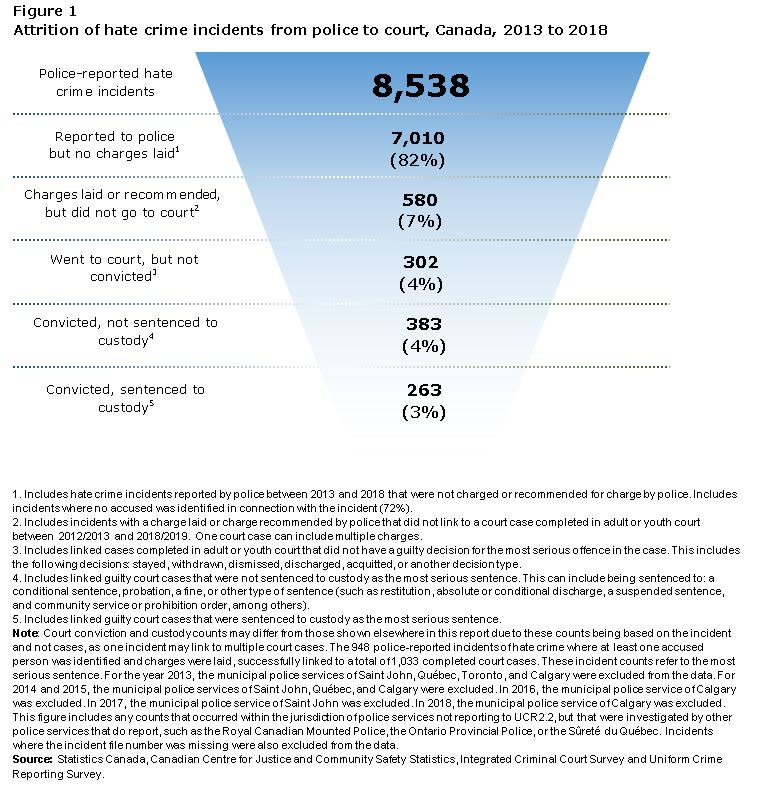
Case attrition is an important element in contextualizing how hate-motivated crimes are handled in the criminal justice system. While an incident may be reported as a hate crime by police, it may not end up in court due to a variety of reasons (Figure 1). Of the 8,538 police-reported hate crimes that were identified, 82% did not result in a charge after being reported by police. This was largely due to the fact that an accused person had not been identified by police, most of which was connected to incidents of mischief, such as vandalism or graffiti. An additional 7% of incidents were charged with a crime, but did not go to court. Of the remaining 11% of police-reported hate crimes that went to court 7% resulted in a finding of guilt.
Figure 1 start
Data table for Figure 1
| Incidents | ||
|---|---|---|
| number | percent | |
| Police-reported hate crime incidents | 8,538 | Note ...: not applicable |
| Reported to police but no charges laidFigure 1 Note 1 | 7,010 | 82 |
| Charges laid or recommended, but did not go to courtFigure 1 Note 2 | 580 | 7 |
| Went to court, but not convictedFigure 1 Note 3 | 302 | 4 |
| Convicted, not sentenced to custodyFigure 1 Note 4 | 383 | 4 |
| Convicted, sentenced to custodyFigure 1 Note 5 | 263 | 3 |
... not applicable
Source: Statistics Canada, Canadian Centre for Justice and Community Safety Statistics, Integrated Criminal Court Survey and Uniform Crime Reporting Survey. |
||
Figure 1 end
Rate of guilty findings for hate-motivated crimes similar to other types of crimes
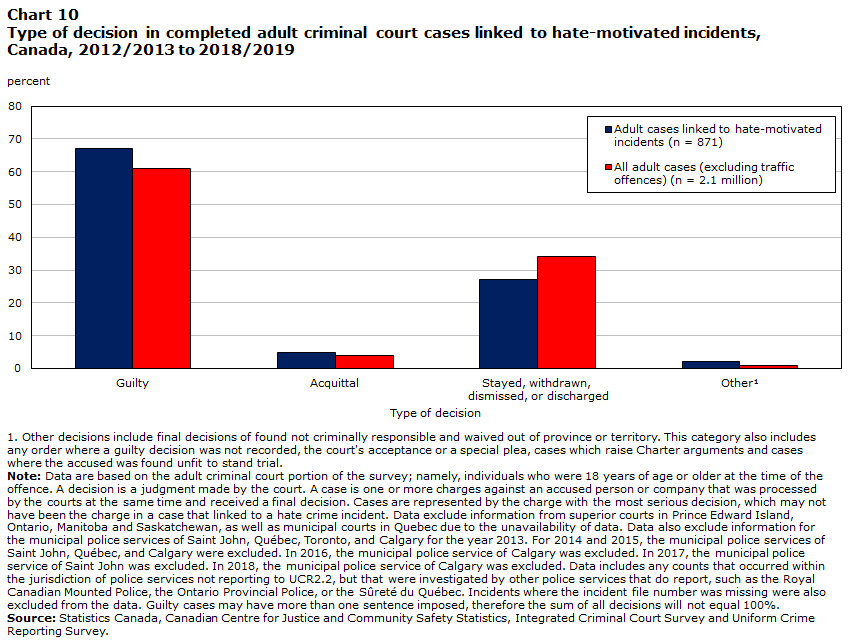
More than six in ten (64%) adult and youth court cases that were linked to a hate-motivated incident resulted in a finding of guilt, for which almost four in ten (39%) resulted in a custody sentence (Table 9). Furthermore, completed court case decisions were similar across different hate crime types, with around two-thirds of cases resulting in a finding of guilt, and just under one-third being stayed, withdrawn, dismissed or discharged. According to the ICCS, 61% of all adult criminal court decisions (excluding Criminal Code traffic offences) resulted in a finding of guilt, and of these, 45% resulted in a custody sentence. In comparison, adult criminal court cases linked to hate-motivated incidents were a bit more likely to result in a finding of guilt (67%)(Chart 10).
Chart 10 start
Data table for Chart 10
| Type of decision | Adult cases linked to hate-motivated incidents (n = 871) | All adult cases (excluding traffic offences) (n = 2.1 million) |
|---|---|---|
| percent | ||
| Guilty | 67 | 61 |
| Acquittal | 5 | 4 |
| Stayed, withdrawn, dismissed, or discharged | 27 | 34 |
| OtherData table for Chart 10Note 1 | 2 | 1 |
Source: Statistics Canada, Canadian Centre for Justice and Community Safety Statistics, Integrated Criminal Court Survey and Uniform Crime Reporting Survey. |
||
Chart 10 end
In this linkage study, case decisions for violent and non-violent offences were similar, with 63% and 67% resulting in a finding of guilt, respectively. Cases completed in adult criminal court were much less likely to be stayed, withdrawn, dismissed or discharged compared to cases completed in youth court (27% compared with 48%). In addition, youth court cases were much less likely to receive a custody sentence once found guilty (8% of guilty cases for youth court, compared with 44% of adult criminal court cases).Note
Majority of hate-motivated crimes that went to court involved a violent offence
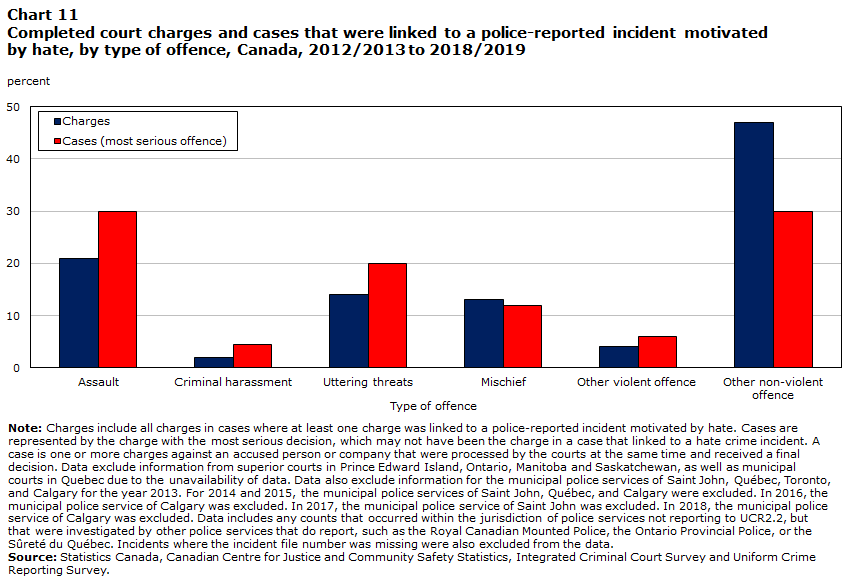
Data in this linkage study suggest that more serious offences reported as hate-motivated are more likely to be pursued by the criminal courts. Overall, 60% of hate-motivated cases had a violent offence as the most serious in the case. A charge of assault (including all levels of assault and assault against a peace officer) was identified as the most serious charge in just under one-third (30%) of hate-motivated cases in this study, making it the most common most serious offence, followed by uttering threats (20%) and mischief (12%) (Chart 11).
Chart 11 start
Data table for Chart 11
| Type of offence | Charges | Cases (most serious offence) |
|---|---|---|
| percent | ||
| Assault | 21 | 30 |
| Criminal harassment | 2 | 4 |
| Uttering threats | 14 | 20 |
| Mischief | 13 | 12 |
| Other violent offence | 4 | 6 |
| Other non-violent offence | 47 | 30 |
|
Note: Charges include all charges in cases where at least one charge was linked to a police-reported incident motivated by hate. Cases are represented by the charge with the most serious decision, which may not have been the charge in a case that linked to a hate crime incident. A case is one or more charges against an accused person or company that were processed by the courts at the same time and received a final decision. Data exclude information from superior courts in Prince Edward Island, Ontario, Manitoba and Saskatchewan, as well as municipal courts in Quebec due to the unavailability of data. Data also exclude information for the municipal police services of Saint John, Québec, Toronto, and Calgary for the year 2013. For 2014 and 2015, the municipal police services of Saint John, Québec, and Calgary were excluded. In 2016, the municipal police service of Calgary was excluded. In 2017, the municipal police service of Saint John was excluded. In 2018, the municipal police service of Calgary was excluded. Data includes any counts that occurred within the jurisdiction of police services not reporting to UCR2.2, but that were investigated by other police services that do report, such as the Royal Canadian Mounted Police, the Ontario Provincial Police, or the Sûreté du Québec. Incidents where the incident file number was missing were also excluded from the data. Source: Statistics Canada, Canadian Centre for Justice and Community Safety Statistics, Integrated Criminal Court Survey and Uniform Crime Reporting Survey. |
||
Chart 11 end
Summary
Canada is a multicultural and diverse country, and it is important to understand the experiences of this diverse population, including the nature and extent of hate-motivated crime. The number of police-reported hate crimes in Canada was up 7% in 2019 compared to 2018, from 1,817 incidents to 1,946. Following a sudden increase in 2017, the number of police-reported hate crimes in Canada has remained higher than the previous 10 year average. The year-over-year increase in 2019 was the result of more incidents throughout the country, as only Alberta reported a decrease from 2018.
Nationally, there were more police-reported hate crimes targeting race or ethnicity, specifically Arab or West Asians and Blacks, as well an increase in crimes targeting sexual orientation. While there were fewer police-reported hate crimes targeting religion, including the Jewish population, those targeting the Muslim population rose. Overall, crimes targeting the Black, Jewish and Muslim populations were the most prevalent types of police-reported hate crime in Canada, continuing a trend from previous years.
Both non-violent and violent hate crimes increased from 2018 to 2019, contributing nearly equally to the overall increase in hate crime. The increase in non-violent hate crimes was primarily due to an increase in mischief offences (excluding mischief in relation to property used primarily for worship or by an identifiable group). The rise in violent hate crimes was driven by increases in incidents of common assault and uttering threats. Overall in 2019, less than half (44%) of hate crimes were violent, the same proportion as in 2018.
Although the majority of hate crimes are non-violent, analysis of characteristics of hate crimes reported to police between 2010 and 2019 suggest that hate-motivated crimes targeting sexual orientation, the South Asian, the Arab or West Asian, and the East and Southeast Asian populations are more likely to be violent than non-violent.
This multi-year analysis provides other insights into the variations in hate crimes across various groups. For instance, victims of violent hate crimes targeting sexual orientation and the Indigenous population tend to be the youngest among hate crime victims and sustain the highest rate of injury. Further, compared to other hate crime victims, victims of crimes targeting East and Southeast Asian population and the Muslim population were most likely to be victimized by strangers. In contrast, the rate of victimization by someone known to the victim was highest among victims of hate crimes targeting Black populations and sexual orientation.
Detailed data tables
Table 1 Police-reported hate crimes, by detailed motivation, Canada, 2015 to 2019
Table 2 Police-reported hate crimes, by most serious violation, Canada, 2018 and 2019
Table 3 Police-reported hate crimes, by type of motivation, province or territory, 2017 to 2019
Table 5 Number and rate of police-reported hate crimes, by census metropolitan area, 2017 to 2019
Table 6 Characteristics of hate crime victims, by motivation, Canada, 2010 to 2019
Table 8 Characteristics of persons accused of hate crimes, Canada, 2010 to 2019
Survey description
Incident-based Uniform Crime Reporting Survey
This article uses data from the Incident-based Uniform Crime Reporting Survey (UCR2). This is a microdata survey that captures detailed information on crimes reported to and substantiated by police, comprising the characteristics of victims, accused persons and incidents. In response to changing information needs, the survey was modified in 2005 (UCR2.2) to enable identification of incidents motivated by hate based on race, national or ethnic origin, religion, sexual orientation, gender identity or expression, language, sex, age, mental or physical disability, or any other similar factor.
In the UCR Survey, police services can report up to four offences per incident. However, to conform to statistical reporting standards for this survey, only the most serious offence in an incident is used in this analysis.
In 2019, police services reporting to the UCR 2.2 version of the survey or higher served 99.7% of the population of Canada.
A supplemental survey has been conducted each year since 2006 as a means of obtaining information on hate-motivated crimes from those police services reporting microdata but which had not yet converted their electronic reporting systems to the newest UCR2 version. These respondents were asked to identify those criminal incidents that had been motivated by hate and to manually provide aggregate counts of incidents by the detailed motivation to Statistics Canada. Additional information (e.g., type of crime, weapon use, level of injury and relationship) cannot be provided by these respondents.
The Oshawa census metropolitan area (CMA) is excluded from the analysis of hate crimes by CMA due to the incongruity between the police service jurisdictional boundaries and the CMA boundaries. For the same reason, data from the Halton and Durham police services are also excluded. The exclusion of information from Halton police affects the coverage for the Toronto and Hamilton CMAs. The exclusion of information from the Durham police affects coverage for Toronto. As a result, information for the CMA of Toronto reflects data from police serving 90% of the population of the CMA of Toronto. For Hamilton, data cover 65% of the Hamilton CMA population.
The UCR2 Survey collects information on victims of violent crimes when they are identified in an incident. In 2019, information on 822 victims of violent offences was reported in 688 hate crime incidents. In 14% of violent hate crime incidents involving victims, more than one victim was identified. Information on victims reflects data reported by police services covering 99.7% of the population of Canada. It is not provided by police services reporting to the UCR 2.2 Supplemental Survey.
UCR2 also collects information about persons accused of hate crime. In 2019, there was information on 717 accused individuals associated with 633 incidents. In 8% of these incidents, more than one accused was identified. Information on accused reflects data reported by police services serving 99.7% of the population of Canada. It is not provided by police services reporting to the UCR 2.2 Supplemental Survey.
Data on hate crimes are also available in Tables 35-10-0066-01, 35-10-0067-01, and 35-10-0191-01.
Integrated Criminal Court Survey
The Integrated Criminal Court Survey (ICCS) collects statistical information on adult and youth court cases involving Criminal Code and other federal statute offences.
All adult courts have reported to the adult component of the survey since the 2006/2007 fiscal year, with the exception of superior courts in Ontario, Manitoba and Saskatchewan as well as municipal courts in Quebec. Superior court information for Prince Edward Island was unavailable until 2018/2019. These data were not available for extraction from the provinces' electronic reporting systems and therefore, were not reported to the survey.
The primary unit of analysis is a case. A case is defined as one or more charges against an accused person or company that were processed by the courts at the same time and received a final decision. A case combines all charges against the same person having one or more key overlapping dates (date of offence, date of initiation, date of first appearance, date of decision, or date of sentencing) into a single case.
Record linkage
In order to explore how police-reported hate crimes are processed in court, a deterministic record linkage was performed, linking police-reported data on hate crime incidents from 2013 to 2018 to data on completed adult criminal and youth court charges 2012/2013 to 2018/2019 for ICCS data. Police-reported incidents were considered in-scope if the incident was determined to be a hate crime; there was at least one accused person associated with the incident and; charges were laid or recommended.
The record linkage project paired in-scope police-reported incidents with completed court charges in adult criminal and youth courts, based on a specific set of variables, including province, accused Soundex (an algorithm that encodes names for confidentiality reasons), date of birth of the accused, sex of the accused, and the date of the offence.
The majority of incidents of hate crime are not cleared (meaning not solved), either because the case remains under investigation, there is insufficient evidence to proceed with the case or the victim declines to proceed having not identified a perpetrator. In 2019, one-third (33%) of hate crime incidents were cleared.
The final linkage rate of incidents, after removing duplicate records and potentially false or bad links, was 62%. There are some important caveats to note when interpreting the linkage rate and subsequent analysis of results.
- Incidents and charges in the province of Quebec are included as in-scope, however, Quebec had a much lower quality of linkage; 40% of incidents in Quebec were successfully linked to a completed charge.
- The absence of data from superior courts in Prince Edward Island, Ontario, Manitoba, and Saskatchewan likely impacts the analysis, as indictable offences may be underrepresented in data from jurisdictions where only the provincial or territorial courts report data.
- Some incidents that did not successfully link to a completed charge may still be before the courts, particularly in recent years where the linkage rates were noticeably lower. As the ICCS data reflects only completed charges, those which are still active in the court system are not reflected in this linkage.
- Some incidents may not have successfully linked to a court charge for data quality reasons, such as missing or inconsistent values in key linking variables.
- Some of the linkage gap may reflect attrition between the police and courts, as some charges are not pursued beyond the police stage. However, given the above limitations, it is not possible to estimate the extent to which attrition accounts for unlinked incidents.
References
Armstrong, A. 2019. “Police-reported hate crime in Canada, 2017.” Juristat. Statistics Canada Catalogue no. 85-002-X.
Arriagada, P., T. Hahmann, and V. O’Donnell. 2020. “StatCan COVID-19: Data to insights for a better Canada Indigenous people in urban areas: Vulnerabilities to the socioeconomic impacts of COVID-19.” StatCan COVID-19: Data to insights for a better Canada. Statistics Canada Catalogue no. 45-28-0001.
B’nai Brith Canada. 2020. “Annual audit of antisemitic incidents 2019.” B’Nai Brith Canada. (accessed January 15, 2021).
Ben-Porat, Guy. 2008. “Policing multicultural states: lessons from the Canadian model.” Policing and Society. Vol. 18, no. 4, p. 411-425.
Bombay, A., K., Matheson, K., and H., Anisman. 2009. “Intergenerational trauma: Convergence of multiple processes among First Nations peoples in Canada.” Journal of Aboriginal Health. p. 6-47.
Bombay, A., K., Matheson, K., and H., Anisman. 2011. “The impact of stressors on second generation Indian residential school survivors.” Transcultural Psychiatry. 48(4), 367-391.
Bombay, A., K., Matheson, K., and H., Anisman. 2014. “The intergenerational effects of Indian Residential Schools: Implication for the concept of historical trauma.” Transcultural Psychiatry. 51(3), 320-338.
Boyce, J. 2016. “Victimization of Aboriginal people in Canada, 2014.” Juristat. Statistics Canada Catalogue no. 85-002-X.
Brown, Ben and Wm. Reed Benedict. 2002, “Perceptions of the police: Past findings, methodological issues, conceptual issues and policy implications.” Policing: An International Journal of Police Strategies and Management. Vol. 25, no. 3. p. 543-580.
Burczycka, M. 2020. “Students’ experiences of discrimination based on gender, gender identity or sexual orientation at postsecondary schools in the Canadian provinces, 2019.” Juristat Bulletin – Quick Fact. Statistics Canada Catalogue no. 85-005-X.
Canadian Heritage. 2019. Building a Foundation for Change: Canada’s Anti-Racism Strategy 2019-2022. Ottawa. (accessed January 15, 2021).
Canadian Race Relations Foundation. 2020. Hate crime in Canada. (accessed January 15, 2021).
CBC News. 2020. “Vancouver police launch task force to address spike in hate crime.” CBC News. (accessed January 15, 2021).
Chan, Wendy and Kiran Mirchandani. 2002. Crimes of Colour: Racialization and the Criminal Justice System in Canada. Peterborough. Broadview Press.
Cotter, A. 2015. Spotlight on Canadians: Results from the General Social Survey – Public Confidence in Canadian Institutions. Statistics Canada Catalogue no. 85-652-X.
Cotter, A. 2018. “Violent victimization of women with disabilities, 2014.” Juristat. Statistics Canada Catalogue no. 85-002-X.
Cotter, A. and L. Savage. 2019. “Gender-based violence and unwanted sexual behaviour in Canada, 2018: Initial findings from the Survey of Safety in Public and Private Spaces.” Juristat. Statistics Canada Catalogue no. 85-002-X.
Council of Canadian Academies, 2019. “Toward peace, harmony, and well-being: Policing in Indigenous communities.” The Expert Panel on Policing in Indigenous Communities. Council of Canadian Academies. Ottawa, Ontario.
Davey, J., C. Guerin and M. Hart. 2020. “An online environmental scan of right-wing extremism in Canada.” ISD Global. (accessed January 15, 2021).
Edmonton Police Service. 2018. Hate and Bias Crime. (accessed January 15, 2021).
Fight COVID racism. 2020. Fight COVID Racism: About. (accessed January 15, 2021).
Government of Canada. 2019. Canada’s Digital Charter. Toronto.
Heidinger, L. and A. Cotter. 2020. “Perceptions of personal safety among population groups designated as visible minorities in Canada during the COVID-19 pandemic.” STATCAN COVID-19: Data to Insights for a Better Canada. Statistics Canada Catalogue no. 45280001.
Ibrahim, D. 2018. “Violent victimization and discrimination, by religious affiliation in Canada, 2014.” Juristat. Statistics Canada Catalogue no. 85-002-X.
Ibrahim, D. 2020. “Public perceptions of the police in Canada’s provinces, 2019.” Juristat. Statistics Canada Catalogue no. 85-002-X.
Jaffray, B. 2020. “Experiences of violent victimization and unwanted sexual behaviours among gay, lesbian, bisexual and other sexual minority people, and the transgender population, in Canada, 2018.” Juristat. Statistics Canada Catalogue no. 85-002-X.
Jones, N.A., Ruddell, R., Nestor, R., Quinn, K. and Phillips, B. 2014. “First Nations policing: A review of the literature.” Collaborative Centre for Justice and Safety. Regina, Saskatchewan.
Kotyk, A. 2020. “Anti-Asian hate crime incidents rose by 878% compared to last year, Vancouver police report says.” CTV News Vancouver. (accessed January 15, 2021).
Miladinovic, Z. and L. Mulligan. 2015. “Homicide in Canada, 2014.” Juristat. Statistics Canada Catalogue no. 85-002-X.
Moonshot CVE. 2020. “Covid-19: Increase in far-right searches in Canada.” Moonshot CVE. (accessed January 15, 2021).
Moreau, G. 2020. “Police-reported crime statistics in Canada, 2019.” Juristat. Statistics Canada Catalogue no. 85-002-X.
Morris, S., Fawcett, G., Brisebois L. and J. Hughes. 2018. “A demographic, employment and income profile of Canadians with disabilities aged 15 years and over, 2017.” Canadian Survey on Disability Reports. Statistics Canada Catalogue no. 89-654-X.
National Council of Canadian Muslims. 2014. 2013 ODIHR Hate Crime Report. Ottawa.
National Council of Canadian Muslims. 2017. 2016 ODIHR Hate Crime Report. Ottawa.
National Inquiry into Missing and Murdered Indigenous Women and Girls (MMIWG). 2019. Reclaiming Power and Place: The Final Report on the National Inquiry into Missing and Murdered Indigenous Women and Girls.
Nilson, Chad and Barb Mantello. 2019. “Joining the circle: Identifying key ingredients for effective police collaboration within Indigenous communities.” Community Safety Knowledge Alliance. Saskatoon, Saskatchewan.
Office for Democratic Institutions and Human Rights. 2014. Hate Crimes in the Organization for Security and Co-operation in Europe Region–Incidents and Responses: Annual Report for 2014.
Office for Democratic Institutions and Human Rights. 2018. Prosecuting Hate Crimes: A Practical Guide.
Office for Democratic Institutions and Human Rights. 2020. Capacity Building Efforts.
Ontario Tech University. 2020. “Ontario Tech University and Facebook Canada create global network to address online hate”. Ontario Tech University. (accessed January 15, 2021).
Perreault, S. 2013. “Self-reported internet victimization in Canada, 2009.” Juristat. Statistics Canada Catalogue no. 85-002-X.
Perreault, S. 2015. “Criminal victimization in Canada, 2014.” Juristat. Statistics Canada Catalogue no. 85-002-X.
Perry, B. 2010. “Policing hate crime in a Multicultural society observations from Canada.” International Journal of Law, Crime and Justice. Vol. 38. p. 120 to 140.
Perry, B. and Scrivens, R. 2016. “Uneasy alliances: A look at the right-wing extremist movement in Canada”. Studies in Conflict and Terrorism. Vol. 39, no. 9. p. 819 to 841.
Perry, B. and Scrivens, R. 2017. “Resisting the Right: Countering right-wing extremism in Canada.” Canadian Journal of Criminology and Criminal Justice. Vol. 59, no. 4. p. 534 to 558.
Project 1907. 2020. Project 1907. (accessed January 15, 2021).
Provost-Yombo, K., C., Louden and S., McDonald. 2021. “Hate as an Aggravating Factor at Sentencing – A Review of the Case Law from 2007 – 2020.” Ottawa: Department of Justice Canada. Available upon request from rsd-dsr@justice.gc.ca.
Public Safety Canada. 2018a. Funding Project Descriptions: Canada Redirect. (accessed January 15, 2021).
Public Safety Canada. 2018b. National Strategy on Countering Radicalization to Violence. (accessed January 15, 2021).
Public Safety Canada. 2020. Funding Project Descriptions: Block Hate: Building Resilience Against Online Hate Speech. (accessed January 15, 2021).
Ryerson. 2020. Responding to Hate Toolkit. (accessed January 15, 2021).
Scrim, K. 2009. Aboriginal Victimization in Canada: A Summary of the Literature. Department of Justice.
Selkirk, Morgan. 2020. “Visible minority status and confidence in the police.” The Sociological Imagination: Western’s Undergraduate Sociology and Criminology Student Journal. Vol. 6, no. 1.
Simpson, L. 2018a. “Violent victimization and discrimination among visible minority populations, Canada, 2014.” Juristat. Statistics Canada Catalogue no. 85-002-X.
Simpson, L. 2018b. “Violent victimization of lesbians, gays and bisexuals in Canada, 2014.” Juristat. Statistics Canada Catalogue no. 85-002-X.
Statistics Canada. 2010. Projections of the Diversity of the Canadian Population: 2006 to 2031. Statistics Canada Catalogue no. 91-551-X.
Statistics Canada. 2013a. Aboriginal Peoples in Canada: First Nations People, Métis and Inuit. National Household Survey, 2011. Statistics Canada Catalogue no. 99-011-X.
Statistics Canada. 2013b. Immigration and Ethnocultural Diversity in Canada. National Household Survey, 2011. Statistics Canada Catalogue no. 99-010-X.
Statistics Canada. 2017a. Study: A Look at Immigration, Ethnocultural Diversity and Languages in Canada up to 2036, 2011 to 2036. Statistics Canada Catalogue no. 91-551-X, Ottawa.
Statistics Canada. 2017b. “Same-sex couples in Canada in 2016.” Census in Brief. Statistics Canada Catalogue no. 98-200-X, Ottawa.
Statistics Canada. 2020. “First Nations people, Métis and Inuit and COVID-19: Health and social characteristics.” The Daily. Statistics Canada Catalogue no. 11-001-X.
Status of Women Canada. 2020a. LGBTQ2 Community Capacity Fund. (accessed January 15, 2021).
Status of Women Canada. 2020b. The Gender-based Violence Strategy. (accessed January 15, 2021).
Stevkovski, L. 2015. “The rise of Right-Wing extremism in European Union.” Interdisciplinary Political and Cultural Journal. Vol. 17, no. 1. p. 43 to 57.
The Truth and Reconciliation Commission of Canada. 2015. Summary of the Final Report of the Truth and Reconciliation Commission of Canada.
Xu, X. 2020. “Data shows an increase in anti-Asian hate incidents in Canada since onset of pandemic.” The Globe and Mail. (accessed January 15, 2021).
York Regional Police. 2018. Diversity, Equity and Inclusion. (accessed January 15, 2021).
- Date modified: