
Portrait of Youth in Canada: Data Report
Chapter 6: Political participation, civic engagement and caregiving among youth in Canada
by Paula Arriagada, Farhana Khanam and Yujiro Sano
Skip to text
Text begins
Introduction
Research shows that political participation and civic engagement are important factors in youth development—they can effectively learn their rights, obligations, and responsibilities as citizens through a range of engagement activities, which can serve as a foundation for their transition to adulthood.Note However, defining civic participation or engagement is not easy. Broadly, engagement is participation in the political process and in organizations, groups or networks built around a common interest. Sometimes the goal is to address major social issues, while in other cases it is simply recreational. Engagement can also include caregiving, which is when individuals provide care and support to people in their families and communities. This report uses Statistics Canada survey data to describe the civic engagement activities and political participation of young people in Canada, defined as those aged 15 to 30.Note
The first section of this report focuses on political participation. Specifically, it examines indicators such as voter turnout in federal, provincial and municipal elections; the main reasons why youth do not vote; and whether youth plan to vote in the future. Voting is not the only form of political engagement, though, so this analysis also focuses on non-electoral political activities such as expressing views on the Internet, signing petitions, and participating in marches and demonstrations.
The second section explores other dimensions of civic engagement such as participating in groups, organizations and associations and formal and informal volunteering. Existing research shows that involvement in such activities can be helpful for youth to acquire meaningful democratic skillsNote and allows them to learn useful skills such as collaboration and problem-solving.Note Civic engagement can also improve youth health and well-beingNote and plays an important role in maintaining and enhancing the well-being of communities.Note
The final section of this report focuses on unpaid caregiving as a form of engagement, with an emphasis on the type of care provided and the relationship between caregiver and primary care receiver. Providing care to family members or friends can have many benefits, such as reducing the social cost of health and other institutional services.Note However, research also shows that caregiving has adverse effects on caregivers, and young caregivers in particular. Although many young caregivers view it as a positive experience, there are greater social and academic risks, as well as mental and physical health risks, when caregiving interferes with other activities.Note
The COVID-19 pandemic has drastically affected where and how youth are able to volunteer, provide care and engage in political and social activities. Although some of the data used in this report predate the pandemic, they provide insight into the challenges to and opportunities for youth engagement. Meanwhile, the data on political engagement and participation in organizations and groups were collected during the pandemic and indicate how youth pursued civic engagement while faced with public health restrictions.
Section 1: Political engagement of youth in Canada
Youth aged 15 to 30 are less likely to be interested in politics than older adults
According to the 2020 General Social Survey (GSS) on Social Identity, 60% of youth aged 15 to 30 reported being somewhat or very interested in politics, which is significantly lower than the 68% among those aged 31 to 46, and 74% of those aged 47 and older.
Among youth aged 15 to 30, a higher proportion of men (62%) than women (56%) reported being very or somewhat interested in politics; however, the difference is not significant.
The results also show that youth who belong to population groups designated as visible minoritiesNote were significantly less likely than their non-visible minority counterparts to report being interested in politics. Specifically, just over half (52%) of youth who belong to population groups designated as visible minorities reported being very interested or somewhat interested in politics, while the proportion was 64% of non-visible minorities.Note
More than three-quarters of Canadian youth voted in the 2019 federal election
Although there are many factors associated with voter turnout, such as level of education and immigrant status, age plays a significant role on voting in Canada.Note Among those eligible to vote, Canadian youth aged 18 to 30 were significantly less likely to vote in the 2019 federal election (80%) compared with 86% of those aged 31 to 46 and 90% for those aged 47 and older (Table 1). This is consistent with data from previous federal elections, where youth were also the group least likely to vote.Note
Previous studies and post-election surveys have consistently reported higher voter turnout rates than Elections Canada.Note For example, Elections Canada data showed that 54% of youth aged 18 to 24 voted in the 2019 federal election, compared with 78% reported in the 2020 GSS.Note Even though GSS data overestimate voting rates, existing studies have shown that the key demographic characteristics associated with voting (e.g., age and gender) are generally the same between the GSS and Elections Canada data.Note Using data from the GSS allows us to examine characteristics beyond age and gender, as well as the reasons people choose not to vote.
| Election type | 18 to 30 years (ref.) | 31 to 46 years | 47 years and older |
|---|---|---|---|
| percentage | |||
| Last federal election | 79.7 | 85.5Note * | 89.9Note * |
| Last provincial election | 72.7 | 84.8Note * | 88.7Note * |
| Last municipal election | 52.5 | 68.2Note * | 77.7Note * |
Source: Statistics Canada, General Social Survey on Social Identity, 2020. |
|||
The results in Table 1 also show that youth are less likely to vote in provincial and municipal elections than older Canadians. For example, among those eligible to vote, 73% of youth aged 18 to 30 voted in the last provincial election, while the proportions were higher for those aged 31 to 46 and those 47 and older (85% and 89%, respectively). The same pattern is evident for voting at the municipal level, although voter turnout is lowest in this type of election.
When examining youth voter turnout by gender, the results show that 81% of men and 77% of women voted in the 2019 federal election. Furthermore, youth who belong to population groups designated as visible minorities were less likely to vote (73%) than non-visible minorities (82%).Note
More than 4 in 10 youth reported not voting in the 2019 federal election due to everyday obligations
Respondents who stated that they had not voted in the most recent federal election were asked about their main reason for not voting. Obligations related to everyday life made up the largest proportion of all reasons for not voting given by youth (See Data, Methods and Definitions section). Specifically, 42% of youth aged 18 to 30 reported this as the main reason for not voting, compared with one-third of those aged 31 to 46 and those 47 and older (Table 2). When examining possible responses related to everyday life or health, 17% of youth reported a conflict with their work or school schedule as the main reason for not voting, followed by 14% who reported being out of town or away from home.
In addition, one-third of youth reported political reasons as the main reason for not voting in the last federal election. Specifically, youth were less likely than older adults to report a lack of interest as the main reason for not voting: 11% for youth compared to 17% among those aged 31 to 46 and 19% of those aged 47 and older. However, a larger proportion of youth reported not being informed on political issues as the main reason (12%), followed by 8% of those aged 31 to 46 and 5% among those aged 47 and older.Note
| Reasons for not voting | 18 to 30 years (ref) | 31 to 46 years | 47 years and older |
|---|---|---|---|
| percentage | |||
| Everyday life or health reasons | 41.5 | 32.5 | 32.7 |
| Own illness or disability | 2.2 | 4.2 | 11.4Note * |
| Out of town or away from home | 13.7 | 6.1Note * | 9.8 |
| Too busy | 8.5 | 9.6 | 6.1 |
| Conflicting work or school schedule | 16.5 | 6.8Note * | 3.1Note * |
| Political reasons | 32.4 | 42.4 | 38.2 |
| Not interested | 11.3 | 16.7 | 18.6 |
| Felt voting would not make a difference in results | 4.6 | 8.2 | 8.3 |
| Did not like candidates or campaign issues | 4.8 | 10.0 | 6.3 |
| Not informed on political issues | 11.7 | 7.5 | 4.9Note * |
| Electoral process-related reasons | 2.7 | 1.3 | 3.6 |
| All other reasons | 23.5 | 23.8 | 25.5 |
Source: Statistics Canada, General Social Survey on Social Identity, 2020. |
|||
Fewer youth reported they were very likely to vote in the next federal election compared to older adults
In the GSS 2020, respondents aged 17 and older were asked how likely they were to vote in the next federal election. The results show that the majority of youth (69%) reported they were very likely to vote in the next federal election. In comparison, the proportions were 76% for those aged 31 to 46 and 82% among those aged 47 and older.
Among youth, there were no gender differences in the likelihood of voting in the next federal election. Specifically, 68% of men and 70% of women reported they would likely vote. There were, however, significant differences by visible minority status. Just over half (54%) of youth who belong to population groups designated as visible minorities reported they were likely to vote in the next federal election, which was significantly lower than the 77% among non-visible minorities. This difference may be partly due to the fact that visible minority youth are more likely to face barriers when seeking information about the electoral process and are also less likely to perceive politicians and political parties as being responsive to their interests and needs.Note
Youth are more likely to sign internet petitions and participate in demonstrations than older adults
Voting is not the only form of political engagement. People can also engage in non-electoral political activities such as volunteering for a political party, boycotting particular products for ethical reasons, signing petitions, and participating in marches and demonstrations. This bears considering when focusing on youth, since some research has suggested that young people are more likely to become engaged in ways other than voting.Note
According to data from the 2020 GSS, just over a quarter (67%) of youth aged 15 to 30 searched for information on a political issue in the previous 12 months. In addition, 37% boycotted or chose a product for ethical reasons.
The top non-electoral political activities were generally the same for those aged 31 to 46 and those 47 years and older. There are, however, some significant differences worth mentioning. For example, youth were significantly more likely to sign an internet petition in the past 12 months (48%) compared with older adults (37% for those aged 31 to 46, and 23% for those aged 47 and older). Youth were also significantly more likely to express their views on an issue through an Internet forum or news website (24%), compared to 20% among those aged 31 to 46, and 14% among those aged 47 and older. In addition, 15% of youth reported wearing a badge or t-shirt or displaying a lawn sign in support or opposition of a political or social cause, compared with 12% of adults aged 31 to 46 and 8% of those aged 47 and older. Finally, youth were also significantly more likely to participate in a demonstration or march (14%) than older adults (8% of those aged 31 to 46, and 4% of those aged 47 and older).
It is important to remember that these data were gathered during the pandemic, so public health restrictions and school closures may have greatly limited opportunities for in-person engagement.
Section 2: Civic engagement of youth in Canada
Participation in civic organizations is often driven by people’s personal interests, and it has many benefits for both participants themselves and the community at large. For example, youth are often exposed to unique social and cultural opportunities through which they can nurture their interests in activities like sports, recreation, and education.Note
Involvement in groups or organizations lets participants expand their social networks with new friends and contacts. Organizations can also bring together people from different cultural backgrounds and generations. This participation can have a positive impact on general well-being, as connectedness, social support and sense of belonging are well-known predictors of positive health.Note Finally, at the community level, wide participation in these organizations can foster social trust and cohesion.Note
Youth aged 15 to 30 are more likely to participate in sports or recreational activities than other organizations or associations
Data from the 2020 GSS show that 59% of youth aged 15 to 30 participated in any group, organization or association in the previous 12 months. The proportions are similar for other age groups (61% for those aged 31 to 46 years and 59% among those aged 47 and older).
The results also show that youth were more inclined to be involved in sport or recreational organizations and cultural, educational, or hobby organizations. (Table 3). Specifically, more than half (52%) of youth were members of sport or recreational organizations, which is similar to the proportion for adults aged 31 to 46 (51%) but significantly higher than the 42% of those aged 47 and older. In addition, a third (34%) of youth were involved in cultural, educational or hobby organizations, while 26% of youth were members of school groups, neighbourhood, civic or community associations. Involvement in youth organizations is also most common among youth (16%), compared to 8% among those aged 31 to 46, and 5% for those aged 47 and older.
| Type of group or organization | 15 to 30 years (ref) | 31 to 46 years | 47 years and older |
|---|---|---|---|
| percentage | |||
| Sport or recreational organization | 52.9 | 51.1 | 41.7Note * |
| Cultural, educational, or hobby organization | 34.4 | 29.2 | 32.5 |
| Union or professional association | 23.5 | 45.7Note * | 31.5Note * |
| Political party or group | 4.3 | 6.8Note * | 8.8Note * |
| Religious affiliated group | 17.2 | 18.2 | 24.0Note * |
| School group, neighbourhood, civic or community association | 25.9 | 30.7Note * | 23.9 |
| Humanitarian or charitable organization or service club | 16.5 | 18.4 | 25.3Note * |
| Seniors’ group | 2.0 | 2.3 | 21.0Note * |
| Youth organization | 15.0 | 8.4Note * | 4.8Note * |
| Immigrant or ethnic association or club | 4.3 | 6.3Note * | 5.5 |
| Environmental group | 8.6 | 7.2 | 8.3 |
|
|||
By contrast, compared to older people, youth aged 15 to 30 were less likely to be involved with organizations such as unions or professional associations, political parties or groups, and religious affiliated groups. These findings are consistent with previous work that has found less youth engagement in these types of organizations.Note
Participation in groups, organizations or associations varies by gender
Existing research has shown not only that, among youth, women are more likely to participate in civic organizations than men, but also that women may participate in different types of groups, organizations or associations.Note
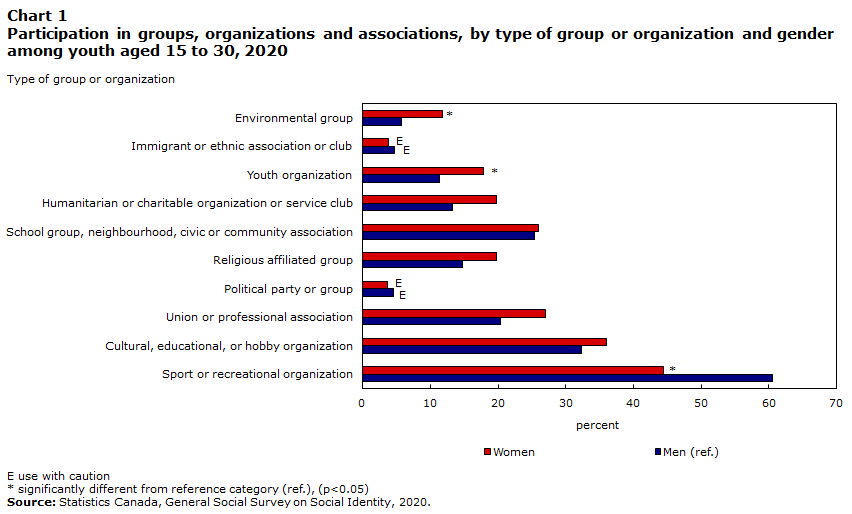
In 2020, the results show that participation in groups or organizations varied by gender, but most of the differences are not significant. For example, young women were more likely than young men to participate in cultural, educational or hobby organizations (36% compared to 32%) and humanitarian or charitable organizations or service clubs (20% compared 13%) in the previous 12 months (Chart 1). Furthermore, young women were more likely than young men to participate in religious affiliated groups (20% compared to 15%).
There are a couple of significant differences, however, as young women are significantly more likely to be members of youth organizations (18% versus 11%) and environmental groups (12% versus 6%). At the same time, men were significantly more likely than women to be involved in sports or recreational organizations (61% versus 45%). This is consistent with previous research which found that young women continue to face a range of barriers to participation in sport and other recreational organizations, such as gender stereotypes, lack of female administrators and coaches, and skewed media coverage of women and men participating in physical activity.Note
Data table for Chart 1
| Type of group or organization | Men (ref.) | Women |
|---|---|---|
| percent | ||
| Sport or recreational organization | 60.5 | 44.5Note * |
| Cultural, educational, or hobby organization | 32.3 | 36.0 |
| Union or professional association | 20.4 | 27.0 |
| Political party or group | 4.5Note E: Use with caution | 3.6Note E: Use with caution |
| Religious affiliated group | 14.8 | 19.7 |
| School group, neighbourhood, civic or community association | 25.4 | 26.0 |
| Humanitarian or charitable organization or service club | 13.3 | 19.8 |
| Youth organization | 11.4 | 17.8Note * |
| Immigrant or ethnic association or club | 4.7Note E: Use with caution | 3.8Note E: Use with caution |
| Environmental group | 5.8 | 11.8Note * |
E use with caution
|
||
Visible minority youth are more likely to participate in school groups and neighbourhood, civic or community associations than non-visible minority youth
In 2020, youth who belong to population groups designated as visible minorities were significantly more likely to be involved in school groups and neighbourhood, civic or community associations than non-visible minorities (32% versus 23%). They were also more likely to participate in religious-affiliated groups (26% versus 12), youth organizations (21% versus 12%) and immigrant or ethnic associations or clubs (9% versus 2%). This is consistent with previous research which has found that religious, immigrant and ethnic organizations are important places for population groups designated as visible minorities, particularly immigrants, for their economic, social, cultural, and political integration.Note The results in this paper illustrate that this trend can be extended to visible minority youth.
By contrast, a significantly smaller proportion of visible minority youth (45%) are involved with sport or recreational organizations than non-visible minorities (57%). Previous research suggests that visible minorities are less likely to participate in recreational activities than non-visible minorities, partially due to the use of non-official languages at home, lack of knowledge about such activities, and financial barriers.Note
Youth and volunteering
Another way to examine youth engagement is to focus on volunteering. Volunteerism is the participation in purposeful helping activities without monetary compensation.Note It can involve a number of different activities to benefit a range of organizations or groups, and it can take place occasionally over a year or on a more consistent basis.Note
While the data used in this section were collected prior to the COVID-19 pandemic, they nonetheless provide insight into youth volunteering and the challenges and opportunities they face now. It is also important to note that volunteering refers to both formal and informal volunteering. Specifically, formal volunteers are those who do activities without pay on behalf of a group or organization, while informal volunteers work to improve their community on their own or give help directly to people outside their household, including friends, neighbours or relatives.
The rate of formal volunteering was 46% among youth aged 15 to 30
According to data from the 2018 General Social Survey on Giving, Volunteering and Participating, the rate of formal volunteering was highest among youth aged 15 to 30, with 46% volunteering their time. Consistent with existing research,Note volunteer rates drop with age: 44% of those aged 31 to 46 volunteered in 2018 and 38% of those 47 years and older.Note
In 2018, there was no significant difference in the volunteer rate between men and women among youth aged 15 to 30 (42% and 49%, respectively). However, among the older age groups, women were significantly more likely to volunteer than men.
The higher rate of formal volunteering for youth may be partly influenced by “mandatory” volunteering.Note Among those aged 15 to 30, 16% were required to do unpaid activity by school or some other way in 2018.Note The proportions were significantly lower for the other age groups: 5% for those aged 31 to 46 and 3% for those aged 47% and older.
When examining only youth aged 15 to 19, the results show that 31% were required to do unpaid activity. Among those aged 15 to 19 who reported they were required to do unpaid activity, most of them (91%) reported they were required by school either as a graduation requirement or co-op program. However, it is important to note that mandatory volunteering is a fairly small proportion of the total hours contributed by young volunteers.Note
Almost a quarter of youth volunteered their time to organizations providing social services
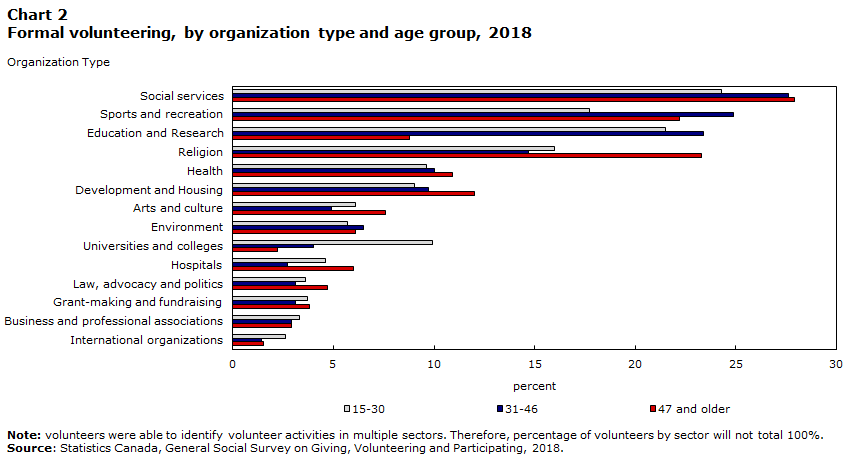
Youth volunteering varies across different types of organizations. Specifically, young volunteers were most likely to give their time to social services (24%), education and research (22%), sports and recreation (18%) and religious organizations (16%) in 2018 (Chart 2). This was consistent with research which has found that these organizations are where the greater proportion of people volunteer.Note
Data table for Chart 2
| Organization Type | 47 and older | 31-46 | 15-30 |
|---|---|---|---|
| percent | |||
| International organizations | 1.5 | 1.4 | 2.6 |
| Business and professional associations | 2.9 | 2.9 | 3.3 |
| Grant-making and fundraising | 3.8 | 3.1 | 3.7 |
| Law, advocacy and politics | 4.7 | 3.1 | 3.6 |
| Hospitals | 6.0 | 2.7 | 4.6 |
| Universities and colleges | 2.2 | 4.0 | 9.9 |
| Environment | 6.1 | 6.5 | 5.7 |
| Arts and culture | 7.6 | 4.9 | 6.1 |
| Development and Housing | 12.0 | 9.7 | 9.0 |
| Health | 10.9 | 10.0 | 9.6 |
| Religion | 23.3 | 14.7 | 16.0 |
| Education and Research | 8.8 | 23.4 | 21.5 |
| Sports and recreation | 22.2 | 24.9 | 17.7 |
| Social services | 27.9 | 27.6 | 24.3 |
|
Note: Volunteers were able to identify volunteer activities in multiple sectors. Therefore, percentage of volunteers by sector will not total 100%. Source: Statistics Canada, General Social Survey on Giving, Volunteering and Participating, 2018. |
|||
Organizing or supervising events and fundraising are the top volunteer activities among youth
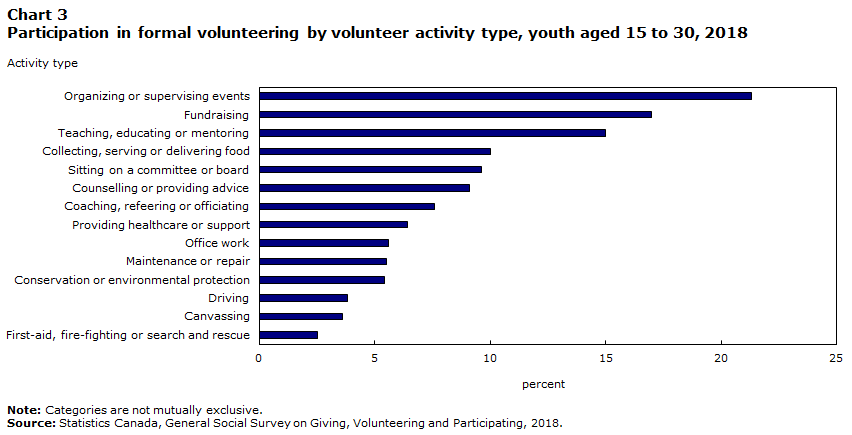
Volunteering can involve a wide array of activities, varying in levels of commitment and necessary skills and experience.Note Youth between the ages of 15 and 30 were most often engaged in organizing events and raising money on behalf of an organization. In 2018, 21% of youth reported organizing, supervising, or coordinating events, and 17% helped with fundraising (Chart 3). The next most common formal volunteer activities included teaching, educating or mentoring (15%), collecting, serving or delivering food (10%), and sitting on a committee or board (10%).
Data table for Chart 3
| Activity type | Youth (15-30) |
|---|---|
| percent | |
| First-aid, fire-fighting or search and rescue | 2.5 |
| Canvassing | 3.6 |
| Driving | 3.8 |
| Conservation or environmental protection | 5.4 |
| Maintenance or repair | 5.5 |
| Office work | 5.6 |
| Providing healthcare or support | 6.4 |
| Coaching, refeering or officiating | 7.6 |
| Counselling or providing advice | 9.1 |
| Sitting on a committee or board | 9.6 |
| Collecting, serving or delivering food | 10.0 |
| Teaching, educating or mentoring | 15.0 |
| Fundraising | 17.0 |
| Organizing or supervising events | 21.3 |
|
Note: Categories are not mutually exclusive. Source: Statistics Canada, General Social Survey on Giving, Volunteering and Participating, 2018. |
|
More than three-quarters of youth engaged in informal volunteering in 2018
In 2018, over three-quarters (77%) of youth aged 15 to 30 were informal volunteers; that is, they provided direct help to people outside of their household or were engaged in community improvement outside of a group or organization. The proportions were 77% for those aged 31 to 46 and 70% for those 47 and older.Note
Among youth, 74% helped people directly by providing assistance in activities such as housework and home maintenance; shopping, driving to store or appointments; paperwork; health-related or personal care; teaching, coaching or tutoring.Note The proportion was the same for those aged 31 to 46, and slightly lower for those aged 47 and older (67%).
In terms of improving the community directly (that is, maintaining a park or public space; participating in public meetings; disseminating information; coordinating a group or event; developing an economic or social project), 3 in 10 youth engaged in such activities. Again, there were no significant differences by age group: 30% for those aged 31 to 46 and 25% among those aged 47 and older engaged in improving the community directly.
Section 3: Caregiving among youth in Canada
Many Canadians, including youth, play a central role in providing care to family members or friends with a long-term condition, a physical or mental disability, or problems related to aging. While young caregivers share many similarities with older caregivers, they are also a unique group since they are at a stage in their lives where they have not yet solidified their life plans and choices.Note As a result, being a young caregiver, especially a primary caregiver with many responsibilities, could potentially interfere with life pursuits such as education and career development or leaving home and starting a family.
About one in five youth are caregivers
According to the 2018 General Social Survey on Caregiving and Care Receiving, about 19% (1.5 million) of youth aged 15 to 30 provided care or help to family members or friends with a long-term condition, a physical or mental disability, or problems related to aging (Table 4). In comparison, 21% of those aged 31 to 46 were caregivers, while the proportion was significantly higher (31%) among those aged 47 and older.
| Age group | Total | Men | Women |
|---|---|---|---|
| percentage | |||
| 15 to 30 (ref.) | 19.2 | 20.6 | 17.9 |
| 31 to 46 | 20.9 | 19.4 | 22.4 |
| 47 and older | 30.5Note * | 27.3Note * | 33.5Note * |
|
|||
Previous studies have found that women are more likely to be caregivers than men.Note However, in the case of youth, the proportion who provide care was similar among men (21%) and women (18%). Among older adults, women were significantly more likely to provide care.
Youth were more likely to provide care to grandparents
Research has found that young caregivers are most likely to provide care and support to their grandparents.Note This was the case in 2018, with one-third of all youth caregivers providing care primarily to grandparents in the past 12 months (Table 5). This was followed by caring primarily for parents (31%); friends, colleagues or neighbours (19%); and other family members (12%).
These data were collected prior to the COVID-19 pandemic. Due to public health restrictions and isolation measures, many young caregivers who helped grandparents outside of their household may not have been able to provide care as they usually do. At the same time, youth providing care to parents in their home may have seen their burden of care increase, given the possible lack of outside support.
| Caregiver's age | Primary care receiver | ||||||
|---|---|---|---|---|---|---|---|
| Spouse/ partner | Child | Parent | Parent-in-law | Grandparent | Other family member | Friend, colleague or neighbour | |
| percentage | |||||||
| 15 to 30 (ref.) | 2.8Note E: Use with caution | Note F: too unreliable to be published | 30.8 | Note F: too unreliable to be published | 33.3 | 11.9 | 18.7 |
| 31 to 46 | 7.9Note * | 12.8 | 38.5 | 8.6 | 12.6Note * | 7.9 | 11.5 |
| 47 and older | 17.6Note * | 8.4 | 40.7Note * | 10.5 | Note F: too unreliable to be published | 9.3 | 13.2 |
|
E use with caution F too unreliable to be published
|
|||||||
Across the life cycle, the relationship between the caregivers and the primary care receiver changes. As people age, they are less likely to care primarily for grandparents and more likely to care for parents, a spouse or children. For example, about 40% of caregivers aged 31 to 46 and 47 and older cared primarily for their parents. At the same time, 13% of those aged 31 to 46 cared for their children, and 18% of those aged 47 and older cared for a spouse.
Youth participation in caregiving activities varies by gender
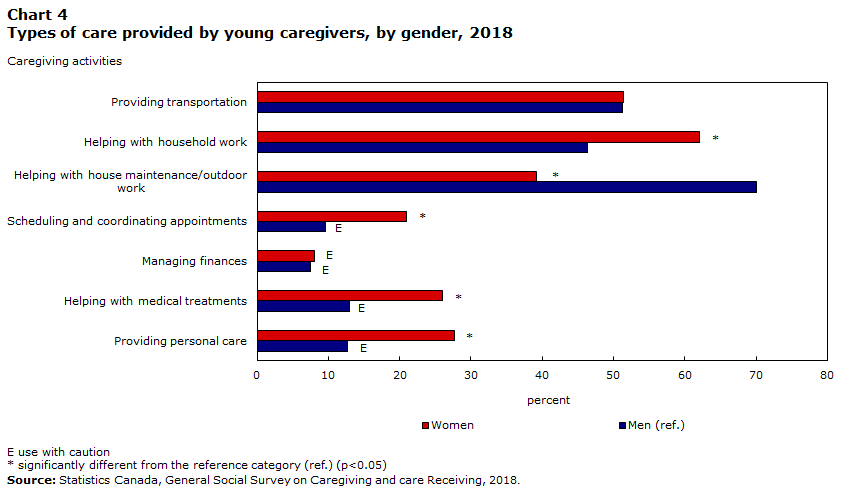
Existing research has shown that caregiving activities tend to be divided by gender. Women are more likely to report helping with housework and personal care, while men more often assist with house maintenance and outdoor work.Note
Data table for Chart 4
| Caregiving activities | Men (ref.) | Women |
|---|---|---|
| percent | ||
| Providing personal care | 12.7Note E: Use with caution | 27.7Note * |
| Helping with medical treatments | 13.0Note E: Use with caution | 26.0Note * |
| Managing finances | 7.5Note E: Use with caution | 8.1Note E: Use with caution |
| Scheduling and coordinating appointments | 9.6Note E: Use with caution | 20.9Note * |
| Helping with house maintenance/outdoor work | 70.0 | 39.2Note * |
| Helping with household work | 46.3 | 62.1Note * |
| Providing transportation | 51.2 | 51.4 |
E use with caution
|
||
For example, among young caregivers, men were more likely than women to undertake house maintenance and outdoor work as part of their caregiving work (70% versus 39%) (Chart 4). Furthermore, young women were more likely than young men to participate in household work activities such as meal preparation, house cleaning or laundry (62% versus 46%) or scheduling and coordinating appointments for the care receiver (21% versus 10E%). Women were also more likely to participate in caregiving activities that often need to be completed on a regular basis or according to a set schedule, such as helping with medical treatments and providing personal care (e.g., bathing or cutting nails). Specifically, 26% of young women provided help with medical treatments, compared with 13E% of young men. And while 28% of women provided personal care, 13E% of men did so.
Conclusion
Political participation, civic engagement and caregiving among youth are important areas to examine as they have a significant impact on youth development, not only in terms of learning rights and responsibilities but also because of the effects engagement can have on their health and well-being.
The results in this chapter show that, although youth are less interested in politics than older adults and are less likely to vote in elections, they do engage in non-electoral political activities such as searching for information on political issues, signing internet petitions or boycotting or choosing products for ethical reasons.
Youth also participate in groups, organizations or associations, especially those related to sports and recreation. There are, however, differences by gender, as well as for youth who belong to groups designated as visible minorities. Youth are also slightly more likely than other age groups to engage in formal volunteering, which can play an important role in improving the well-being of communities.
Finally, many youth are primary caregivers; that is, they help and provide care to a family member or friend with a long-term condition, a physical or mental disability or problems related to aging. While caregiving can be time-consuming and could potentially interfere with education, work or leaving home, it can also be a positive experience, providing a sense of giving back to a loved one and strengthening the relationship between the caregiver and care receiver.
Although this report used multiple data sources to offer a comprehensive look at youth engagement in Canada, there are some key limitations. Specifically, reflecting the diverse nature of youth voices, we examined how their engagement is impacted by key demographic factors such as gender and visible minority status, whenever possible. However, due to the small sample size, it was not possible to disaggregate the data further to highlight, for example, the experiences of non-binary or gender-diverse respondents or specific population groups.
It is also critical to reflect on the context of the COVID-19 pandemic when seeking to better understand youth engagement, especially as some of the data included preceded the pandemic. The implementation of public health measures and restrictions forced youth to modify how they attend school, work, and function in other areas of their lives. It is important that Statistics Canada continue to work towards understanding the effects on youth during and after the COVID-19 pandemic.
Data sources, definitions and methods
Data sources
This report is based on data from three different General Social Survey (GSS) cycles: the 2020 GSS on Social Identity, the 2018 GSS on Giving, Volunteering and Participating, and the 2018 GSS on Caregiving and Care Receiving. The target population for these surveys was all non-institutionalized people aged 15 and older living in the 10 provinces.
Methodology
All estimates in this report using data from the GSS are based on survey weights that account for sample design, non-response, and known population totals. A bootstrapping technique was applied when calculating all estimates of variance. Missing values including "don’t know," "not stated" and "refusal" were excluded from the denominator when calculating percentages. As a result, percentages may vary between different products such as analytical documents and data tables.
Definitions
The question “what is the main reason you did not vote in the last federal election?“ included 17 categories that were divided into four broad groups for this publication:
Everyday life or health reasons: illness or disability; out of town or away from home; too busy; family obligations; conflicting work or school schedule.
Political reasons: not interested; felt voting would not make a difference in results; did not like candidates or campaign issues; not informed on political issues; did not vote to protest.
Electoral process-related reasons: not on voters list or problems with ID requirements; too difficult, transportation problems or too far to travel.
All other reasons: weather conditions; forgot to vote; religious beliefs; undecided; other.
References
Aizlewood, A., Bevelander, P., and Pendakur, R. 2006. Recreational participation among ethnic minorities and immigrants in Canada and the Netherlands. Journal of Immigrant & Refugee Studies, 4(3), 1-32.
Arriagada, Paula. 2020. The experiences and needs of older caregivers in Canada. Insights on Canadian Society. Statistics Canada Catalogue no. 75-006-X.
Bleakney, Amanda. 2014. “Young Canadians providing care.” Spotlight on Canadians: Results from the General Social Survey. Statistics Canada Catalogue no. 89-652-X.
Canadian Fitness and Lifestyle Research Institute. 2018. Sport Participation in Canada: Physical Activity and Sports Monitoring Program. Bulletin 1. Available from: https://cflri.ca/bulletin-1-sport-participation-canada
Chadi, N., and Stamatopoulos, V. 2017. Caring for young carers in Canada. CMAJ, 189(28), E925-E926.
Cicognani, E., Zani, B., Fournier, B., Gavray, C., and Born, M. 2012. Gender differences in youths’ political engagement and participation. The role of parents and of adolescents’ social and civic participation. Journal of Adolescence, 35(3), 561-576.
Flanagan, C., and Levine, P. 2010. Civic engagement and the transition to adulthood. The Future of Children, 20(1): 159-179.
Hahmann, Tara. 2021. Volunteering counts: Formal and informal contributions of Canadians in 2018. Insights on Canadian Society. Statistics Canada Catalogue no. 75-006-X. Ottawa.
Kaida, L., Kitchen, P., and M. Stick. 2021. The Rise of Big-City Hockey Players and its implications for Diversity in the National Hockey League. Canadian Ethnic Studies, 53(3): 141-161.
Kawachi, I. and LF Berkman. 2014. “Social capital, social cohesion and health.” In Berkman, LF, I. Kawachi, and MM Glymour, editors. Social Epidemiology, 2nd edition. New York Oxford, University Press, p. 290-319.
Li, H., and Zhang, J. 2017. How do civic associations foster political participation? The role of scope and intensity of organizational involvement. Nonprofit Policy Forum, 8(1): 3-24.
Mahéo, V. A. and Vissers, S. 2016. The Electoral Participation of Diverse Canadian Youth in the 2015 Federal Election. A Report Commissioned by Elections Canada. Elections Canada: Ottawa, ON.
O’Neill, Brenda. 2007. Indifferent or Just Different? The Political and Civic Engagement of Young People in Canada: Charting the Course for Youth Civic and Political Participation. CPRN Research Report. June. Canadian Policy Research Networks.
Sinha, Maire. 2020. “Volunteering in Canada, 2004 to 2013.” Spotlight on Canadians: Results from the General Social Survey. Statistics Canada Catalogue no. 89-652-X.
Sinha, Maire. 2013. “Portrait of caregivers, 2012.” Spotlight on Canadians: Results from the General Social Survey. Statistics Canada Catalogue no. 89-652-X.
Statistics Canada. 2022. Reasons for not voting in the federal election, September 20, 2021. The Daily, Wednesday, February 16, 2021. Statistics Canada Catalogue no 11-001-X.
Turcotte, Martin. 2015a. Political participation and civic engagement of youth. Insights on Canadian Society. Statistics Canada Catalogue no. 75-006-X.
Turcotte, Martin. 2015b. “Civic engagement and political participation in Canada”. Spotlight on Canadians: Results from the General Social Survey. Statistics Canada Catalogue no. 89-652-X.
Turcotte, Martin. 2015c. “Trends in Social Capital in Canada.” Spotlight on Canadians: Results from the General Social Survey. Statistics Canada Catalogue no. 89-652-X.
Turcotte, Martin. 2013. “Family caregiving: What are the consequences?” Insights on Canadian Society. Statistics Canada Catalogue no. 75-006-X.
Uppal, Sharanjit and Sébastien LaRochelle-Côté. 2012. “Factors associated with voting.” Perspectives on Labour and Income. Statistics Canada Catalogue no. 75-001-X.
Zarrett, N., Veliz, P., and Sabo, D. 2020. Keeping Girls in the Game: Factors That Influence Sport Participation. Women's Sports Foundation.
- Date modified: