
Economic and Social Reports
Gender differences in employment one year into the COVID-19 pandemic: An analysis by industrial sector and firm size
by Douwere Grekou and Yuqian Lu
DOI: https://doi.org/10.25318/36280001202100500005-eng
Abstract
This study describes patterns in employment by gender in the wake of COVID-19 pandemic. It relies on data from the Labour Force Survey and proposes a year-over-year approach that compares monthly employment numbers from March 2020 to February 2021 with numbers in the same months of the previous year. The analysis shows that women tended to be more affected by the COVID-19 pandemic than their male counterparts. On average over the study period, women accounted for 53.7% of the year-over-year employment losses. The differences by gender were disproportionately driven by employment changes in the services sector. For example, of the 2.7 million employment losses in April 2020 relative to April 2019, 75.6% (over 2 million) were in the services sector. The study then explores the role of firm size to find that, within the services sector, employment losses among small firms were disproportionately high and that female employees in small firms were more severely hit than were their male counterparts. Hence, women employed in small firms represented 23.6% of pre-COVID-19 total employment but accounted for 37.9% of the year-over-year decline in employment, while their male counterparts represented 21.9% and 23.6%, respectively.
Authors
Douwere Grekou is currently with the Census Subject Matter Secretariat and worked in the Economic Analysis Division, Analytical Studies Branch when this article was written.
Yuqian Lu is with the Economic Analysis Division, Analytical Studies Branch at Statistics Canada.
Acknowledgements
The authors thank Wulong Gu for his contribution to the data analysis as well as Danny Leung, Emmanuelle Bourbeau, Tatevik Poghosyan and Winnie Chan for valuable comments.
Introduction
The COVID-19 pandemic has disrupted societies and working habits around the world. In Canada, the labour market has been severely affected, with millions of Canadian workers experiencing either loss of employment or reduced working hours (Conference Board 2020a; Conference Board 2020b; Statistics Canada 2020; Grekou 2021).
An important aspect of the COVID-19 pandemic is its disproportional impact across genders (Statistics Canada 2020). This paper studies gender employment gaps using data from the Labour Force Survey (LFS) to analyze the patterns in employment by gender, industrial sector (goods or services) and firm size.Note It proposes a year-over-year approach that compares employment from March 2020 to February 2021 with employment from March 2019 to February 2020.
The study shows that the impact on year-over-year employment losses was consistently more severe for women than for men.Note It finds that the services sector disproportionately drove the overall employment losses and that women were more affected than men in that sector. However, it finds that women in the goods sector were less affected than men in that sector, but this does not affect the trends because women are markedly overrepresented in the services sector. Employment in firms in the services sector with fewer than 100 employees was the most severely hit, and women working in that firm–size category were disproportionately affected.
The study adds to the growing body of evidence on the differences by gender of the effects of the COVID-19 pandemic. The study provides an important contribution for policy: small firms in the services sector have been a main driver of the decline in employment since March 2020. The fact that this decline has been more severe for women requires attention and could be targeted for the recovery.
Section 2 presents the employment concept of the study. Section 3 discusses overall differences by gender. Section 4 analyzes the employment gaps across industrial sectors, while Section 5 adds the firm size dimension. Section 6 concludes.
Definition of employment
In this study, and in the remainder of this paper, “employment” refers to the concept defined in this section. Employment is not seasonally adjusted and employees are restricted to individuals aged 15 and over living in provinces but not in the territories. All classes of work are retained as are individuals at work and individuals absent from work.Note Because the focus of the study is on the business sector, individuals working in the public administration sector (North American Industry Classification System code 91) are excluded.Note All other industries are retained, including those employing a significant number of the public service, such as educational and health services.
All results are statistically significant at 1%.
Overall differences by gender
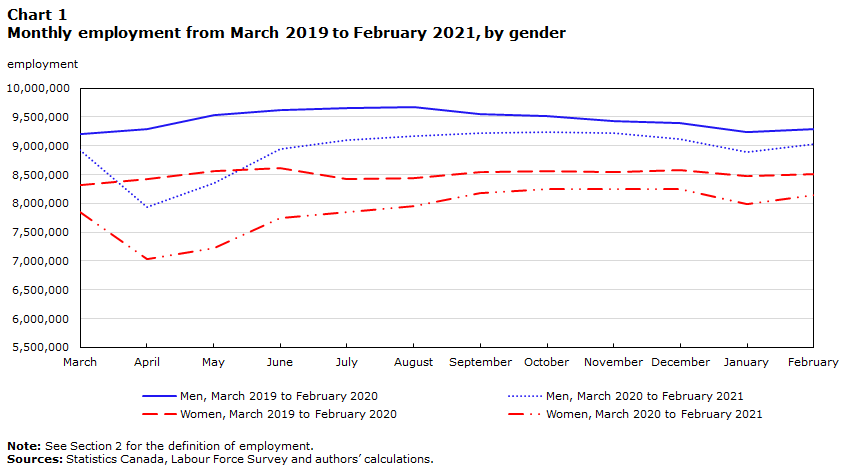
The effect of COVID-19 on employment in Canada was severe. Employment in April 2020 was 2.7 million below April 2019 levels, which represents a 15.5% drop on a year-over-year basis (Chart 1).
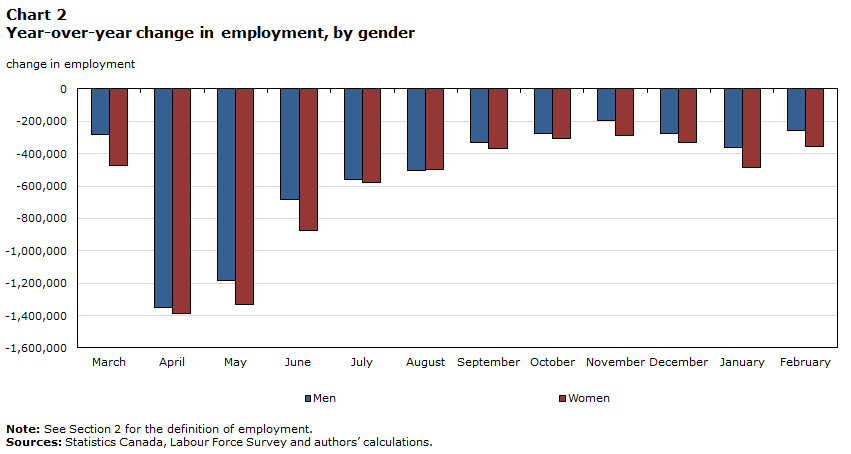
The year-over-year patterns show a steady recovery in employment from May to November 2020 (especially from May to September) and another dip in December 2020 and January 2021 due to the reintroduction of severe restrictions to cope with the increasing number of COVID-19 cases that had begun in September 2020. For all months except August, women were more negatively affected than men (Chart 2 and Table A1 of the appendix). Specifically, while women accounted for, on average, 47.3% of employment pre-COVID-19 (i.e., March 2019 to February 2020), they were disproportionately affected by employment losses due to COVID-19 during the period from March 2020 to February 2021.
At the onset of the pandemic, in March 2020, employment losses for women accounted for 62.5% of overall employment losses (Table A1), possibly linked to the allocation of family responsibilities in households and the fact that the many people perceived restrictions as being temporary. The losses were more balanced over spring 2020 and until September. However, from October 2020 to February 2021, women accounted for 56.4% of the year-over-year employment losses, on average, with a peak in November at 59.6%.Note Over the study period, women accounted for 53.7% of the year-over-year losses in employment.
Therefore, despite a recovery, women’s employment has been consistently more affected than men. The sections below further analyze these employment gaps by industrial sector and firm size.
Data table for Chart 1
| Men, March 2019 to February 2020 | Women, March 2019 to February 2020 | Men, March 2020 to February 2021 | Women, March 2020 to February 2021 | |
|---|---|---|---|---|
| employment | ||||
| March | 9,209,861 | 8,322,710 | 8,926,399 | 7,850,125 |
| April | 9,292,797 | 8,423,101 | 7,940,366 | 7,036,697 |
| May | 9,540,433 | 8,561,818 | 8,356,371 | 7,231,771 |
| June | 9,629,263 | 8,616,970 | 8,945,125 | 7,744,249 |
| July | 9,663,167 | 8,431,743 | 9,104,903 | 7,854,581 |
| August | 9,680,359 | 8,447,802 | 9,176,119 | 7,951,591 |
| September | 9,557,076 | 8,537,571 | 9,225,711 | 8,172,086 |
| October | 9,514,638 | 8,556,669 | 9,239,092 | 8,248,757 |
| November | 9,424,770 | 8,544,062 | 9,229,475 | 8,256,028 |
| December | 9,402,496 | 8,575,665 | 9,125,791 | 8,244,106 |
| January | 9,245,969 | 8,480,058 | 8,886,541 | 7,995,782 |
| February | 9,297,548 | 8,506,343 | 9,037,962 | 8,153,449 |
|
Note: See Section 2 for the definition of employment. Sources: Statistics Canada, Labour Force Survey and authors’ calculations. |
||||
Data table for Chart 2
| Men | Women | |
|---|---|---|
| change in employment | ||
| March | -283,462 | -472,585 |
| April | -1,352,431 | -1,386,404 |
| May | -1,184,062 | -1,330,047 |
| June | -684,138 | -872,721 |
| July | -558,264 | -577,162 |
| August | -504,240 | -496,211 |
| September | -331,365 | -365,485 |
| October | -275,546 | -307,912 |
| November | -195,295 | -288,034 |
| December | -276,705 | -331,559 |
| January | -359,428 | -484,276 |
| February | -259,586 | -352,894 |
|
Note: See Section 2 for the definition of employment. Sources: Statistics Canada, Labour Force Survey and authors’ calculations. |
||
Goods and services sectors
Women are more concentrated in the services sector than men. In February 2020, the services sector (excluding public administration, as described in Section 2) represented 89.8% of employment among women compared with 68.3% for men. Furthermore, women accounted for 54.6% of employment in the services sector but 22.7% of employment in the goods sector.
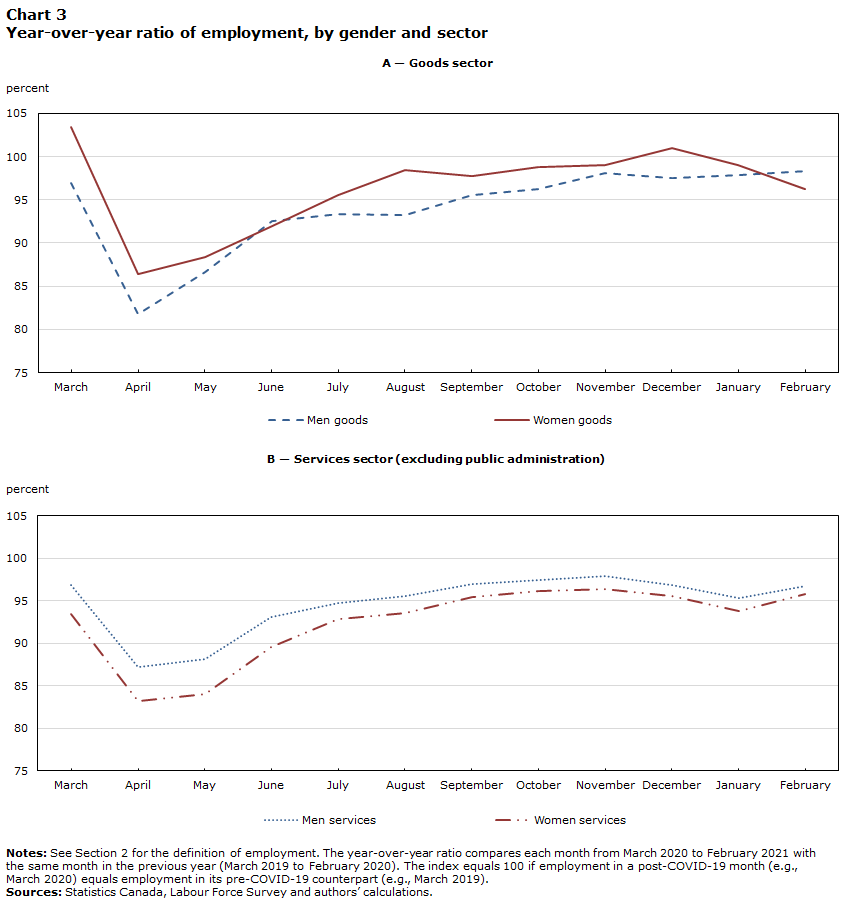
The analysis of the within-sector gap in employment losses by gender due to COVID-19 reveals different patterns. On the one hand, from March 2020 to February 2021, employment of women in the goods sector was relatively less affected than that of men, with the exception of June 2020 and February 2021 (panel A of Chart 3). On the other hand, employment of women in the services sector fell more than for men (panel B of Chart 3).
With the exception of June 2020 and February 2021, the year-over-year employment losses due to COVID-19 were less pronounced for women than for men in the goods sector. A possible explanation could be that a higher proportion of female employees were employed in business, finance and administration occupations in the sector. These occupations were, in general, less affected by restrictions for onsite workplaces and offered a greater ability to work remotely during the pandemic (Dey et al. 2020, using data from the United States).
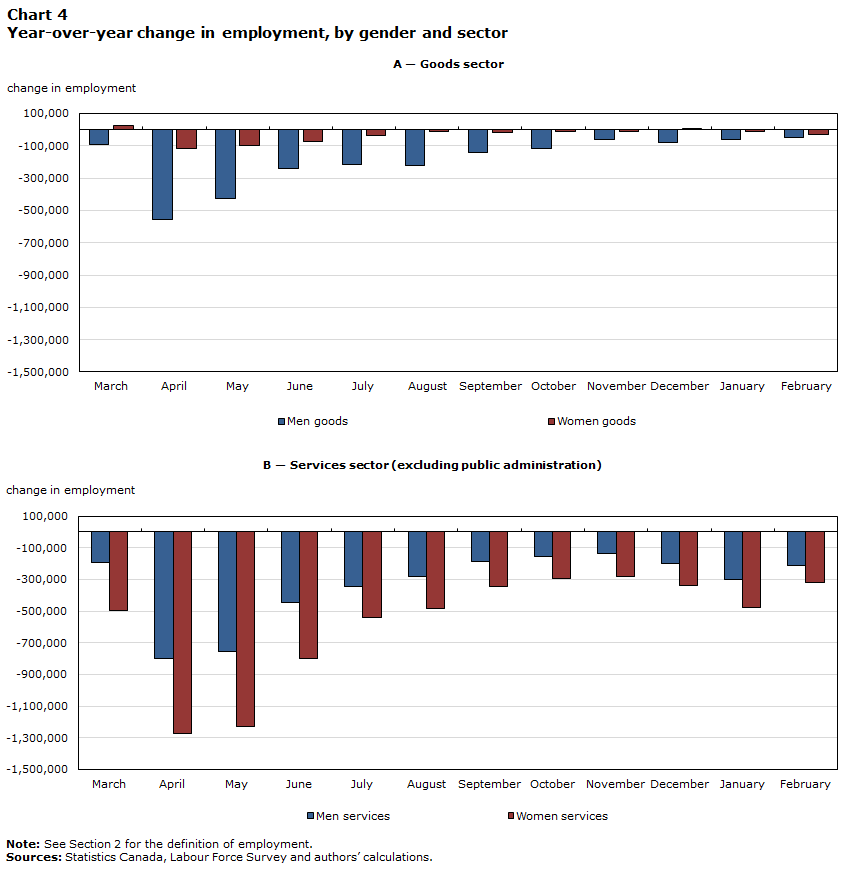
The extent of the decline in employment in the services sector vis-à-vis the goods sector is evident when comparing their year-over-year changes (Chart 4). For example, of the 2.7 million employment losses in April 2020 relative to April 2019, 75.6% (over 2 million) were in the services sector. This could be explained by lockdown measures, which were more severe for service industries.Note
Within the services sector, women were significantly more affected (panel B of Chart 4). Over the March 2020 to February 2021 period, the year-over-year employment losses for women were, on average, 1.8 times larger than for their male counterparts. In addition, in March and November 2020, the year-over-year drop in employment among women was more than two times that of their male counterparts (2.6 times and 2.1 times, respectively).
Although the high concentration of women in the services sector is an important factor in the disproportionate effect of COVID-19 on women’s employment, the large differences in employment loss by gender within that sector remains unexplained. The next section investigates the differences by gender further by breaking down the year-over-year employment changes by size of employer and industrial sectors.
Data table for Chart 3
| Men | Women | |
|---|---|---|
| percent | ||
| A — Goods sector | ||
| March | 96.9 | 103.4 |
| April | 81.8 | 86.4 |
| May | 86.6 | 88.4 |
| June | 92.5 | 92.0 |
| July | 93.4 | 95.6 |
| August | 93.2 | 98.4 |
| September | 95.5 | 97.7 |
| October | 96.2 | 98.8 |
| November | 98.1 | 99.0 |
| December | 97.5 | 101.0 |
| January | 97.9 | 99.0 |
| February | 98.3 | 96.3 |
| B — Services sector (excluding public administration) | ||
| March | 96.9 | 93.4 |
| April | 87.2 | 83.2 |
| May | 88.1 | 84.0 |
| June | 93.1 | 89.6 |
| July | 94.7 | 92.9 |
| August | 95.6 | 93.6 |
| September | 97.0 | 95.5 |
| October | 97.5 | 96.1 |
| November | 97.9 | 96.4 |
| December | 96.9 | 95.6 |
| January | 95.3 | 93.8 |
| February | 96.7 | 95.8 |
|
Notes: See Section 2 for the definition of employment. The year-over-year ratio compares each month from March 2020 to February 2021 with the same month in the previous year (March 2019 to February 2020). The index equals 100 if employment in a post-COVID-19 month (e.g., March 2020) equals employment in its pre-COVID-19 counterpart (e.g., March 2019). Sources: Statistics Canada, Labour Force Survey and authors’ calculations. |
||
Data table for Chart 4
| Men | Women | |
|---|---|---|
| change in employment | ||
| A — Goods sector | ||
| March | -92,392 | 26,935 |
| April | -554,567 | -115,077 |
| May | -426,562 | -101,323 |
| June | -239,859 | -71,108 |
| July | -214,479 | -38,638 |
| August | -219,777 | -13,997 |
| September | -143,926 | -19,744 |
| October | -119,040 | -10,551 |
| November | -59,951 | -8,526 |
| December | -77,879 | 8,728 |
| January | -61,575 | -8,775 |
| February | -48,710 | -32,154 |
| B — Services sector (excluding public administration) | ||
| March | -191,070 | -499,520 |
| April | -797,864 | -1,271,327 |
| May | -757,500 | -1,228,724 |
| June | -444,279 | -801,613 |
| July | -343,785 | -538,524 |
| August | -284,463 | -482,214 |
| September | -187,439 | -345,741 |
| October | -156,506 | -297,361 |
| November | -135,344 | -279,508 |
| December | -198,826 | -340,287 |
| January | -297,853 | -475,501 |
| February | -210,876 | -320,740 |
|
Note: See Section 2 for the definition of employment. Sources: Statistics Canada, Labour Force Survey and authors’ calculations. |
||
Firm size and industrial sectors
The previous section showed a disproportionate effect of the pandemic on women’s employment in the services sector compared with the effect on their male counterparts. This section shows that patterns across firm size within that sector are also important.Note
In the year before the pandemic, small firms (those with fewer than 100 employees) accounted for 45% of employment in the services sector (top panel of Table 1) and experienced more severe declines in employment than in the services sector as a whole (middle panel of Table 1). Furthermore, women employed in small firms represented 23.6% of pre-COVID-19 total employment (top panel of Table 1) but accounted for 37.9% of the year-over-year employment losses (bottom panel of Table 1). Men employed in small firms were also slightly overrepresented in total employment losses (23.6%) relative to their share of pre-COVID-19 employment (21.9%). Moreover, female employees in small firms were more severely affected than their male counterparts in all months studied except August 2020 and February 2021.
Table 1 suggests that the situation was different for large firms (firms with 500 or more employees). This group of firms has been consistently underrepresented in the year-over-year change of employment after the pandemic. For example, on average, over the year following the start of the COVID-19 pandemic, men and women employed in large firms accounted for 11.3% and 18.0% of the year-over-year change in employment, respectively (bottom panel of Table 1). These are significantly lower than their average share of total employment in the months prior to the start of the pandemic (18.5% and 24.6%, respectively; top panel of Table 1).
The changes were more consistent for medium-sized firms. Remarkably, they posted employment gains from August 2020 to February 2021 for men and from August 2020 to January 2021 for women, relative to the same month in the previous year (middle panel, Table 1).
The trends for the goods sector are provided for reference in appendix Table A2. In general, changes in employment in that sector were more proportionate compared with what was observed in the services sector. One of the exceptions is that men employed in small firms were the most affected and accounted for, on average, about half of the year-over-year change in employment (46.8%, bottom panel of Table A2), followed by men employed in large firms (22.5%). On the contrary, women employed in small firms were significantly less affected than their male counterparts except for February 2021. Again, this pattern could be explained by differences in occupations across gender, especially among small firms and self-employed individuals in the goods sector. As discussed in Section 4, it is possible that women, being concentrated in occupations that are more administrative in nature and would therefore have had a greater ability to work remotely, were less affected by onsite restrictions than were men.
| March | April | May | June | July | August | September | October | November | December | January | February | Weighted average | |
|---|---|---|---|---|---|---|---|---|---|---|---|---|---|
| percent | |||||||||||||
| Share of employment in base year, % (pre-COVID-19: March 2019 to February 2020) | |||||||||||||
| Firm size | |||||||||||||
| Small firms, men | 21.2 | 20.9 | 21.4 | 21.4 | 22.0 | 22.3 | 21.5 | 21.5 | 21.2 | 21.1 | 21.2 | 21.3 | 21.4 |
| Small firms, women | 24.2 | 24.1 | 24.0 | 24.0 | 24.2 | 23.6 | 23.4 | 23.2 | 23.3 | 23.3 | 23.0 | 22.9 | 23.6 |
| Medium firms, men | 5.5 | 5.5 | 5.5 | 5.5 | 5.7 | 5.6 | 5.3 | 5.4 | 5.2 | 5.2 | 5.3 | 5.4 | 5.4 |
| Medium firms, women | 6.5 | 6.5 | 6.6 | 6.6 | 6.5 | 6.2 | 6.5 | 6.3 | 6.5 | 6.4 | 6.6 | 6.4 | 6.5 |
| Large firms, men | 18.5 | 18.8 | 18.4 | 18.5 | 18.2 | 18.1 | 18.5 | 18.3 | 18.7 | 18.8 | 18.7 | 18.7 | 18.5 |
| Large firms, women | 24.2 | 24.2 | 24.1 | 24.0 | 23.3 | 24.2 | 24.8 | 25.3 | 25.1 | 25.2 | 25.2 | 25.3 | 24.6 |
| Overall | 100.0 | 100.0 | 100.0 | 100.0 | 100.0 | 100.0 | 100.0 | 100.0 | 100.0 | 100.0 | 100.0 | 100.0 | 100.0 |
| Year-over-year changes, % (March 2020 to February 2021) | |||||||||||||
| Firm size | |||||||||||||
| Small firms, men | -3.4 | -14.2 | -13.6 | -6.1 | -6.7 | -8.2 | -4.2 | -4.2 | -3.4 | -5.7 | -7.0 | -8.3 | -7.1 |
| Small firms, women | -12.9 | -24.6 | -23.0 | -14.4 | -12.5 | -7.4 | -6.5 | -5.7 | -5.8 | -6.8 | -8.0 | -4.9 | -11.1 |
| Medium firms, men | -7.5 | -15.8 | -12.4 | -9.9 | -5.3 | 3.6 | 3.8 | 5.0 | 6.6 | 5.3 | 1.3 | 2.9 | -2.0 |
| Medium firms, women | -4.7 | -11.3 | -15.6 | -10.5 | -4.2 | 0.6 | 2.4 | 7.9 | 0.4 | 3.8 | -9.3 | -1.1 | -3.5 |
| Large firms, men | -1.4 | -10.3 | -9.8 | -6.9 | -3.8 | -2.2 | -3.5 | -2.6 | -3.2 | -2.6 | -3.8 | 0.6 | -4.1 |
| Large firms, women | -0.9 | -10.4 | -9.1 | -6.3 | -2.4 | -7.2 | -4.5 | -5.1 | -2.6 | -4.3 | -3.8 | -4.3 | -5.1 |
| Overall | -5.0 | -15.0 | -14.1 | -8.8 | -6.3 | -5.5 | -3.8 | -3.2 | -3.0 | -3.8 | -5.6 | -3.8 | -6.5 |
| Share of total change, % | |||||||||||||
| Firm size | |||||||||||||
| Small firms, men | 14.5 | 19.8 | 20.5 | 14.9 | 23.3 | 30.9 | 19.9 | 19.1 | 19.3 | 24.8 | 26.1 | 40.9 | 21.9 |
| Small firms, women | 62.0 | 39.6 | 39.1 | 39.3 | 47.8 | 29.4 | 33.4 | 27.9 | 36.8 | 32.4 | 32.2 | 26.2 | 37.9 |
| Medium firms, men | 8.2 | 5.8 | 4.8 | 6.2 | 4.8 | 3.3 | 4.5 | 5.6 | 9.2 | 5.6 | 1.2 | 3.6 | 5.2 |
| Medium firms, women | 6.0 | 4.9 | 7.3 | 7.8 | 4.3 | 0.6 | 3.5 | 10.4 | 0.8 | 5.0 | 10.7 | 1.6 | 5.6 |
| Large firms, men | 5.0 | 13.0 | 12.8 | 14.5 | 11.0 | 6.6 | 14.1 | 9.9 | 16.0 | 9.8 | 12.6 | 2.5 | 11.3 |
| Large firms, women | 4.3 | 16.9 | 15.5 | 17.2 | 8.8 | 29.2 | 24.5 | 27.1 | 18.0 | 22.3 | 17.0 | 25.1 | 18.0 |
| Overall | 100.0 | 100.0 | 100.0 | 100.0 | 100.0 | 100.0 | 100.0 | 100.0 | 100.0 | 100.0 | 100.0 | 100.0 | 100.0 |
|
Notes: See Section 2 for the definition of employment. The year-over-year ratio compares each month from March 2020 to February 2021 with the same month in the previous year (March 2019 to February 2020). The index equals 100 if employment in a post-COVID-19 month (e.g., March 2020) equals employment in its pre-COVID-19 counterpart (e.g., March 2019). Sources: Statistics Canada, Labour Force Survey and authors’ calculations. |
|||||||||||||
Conclusion
One year after the outbreak of COVID-19 began, women have been more severely affected by employment losses than their male counterparts. This study explored the differences in the gender concentration in the goods and services sectors as well as firm size for possible explanations.
A higher concentration of women are employed in the services sector, which has experienced more severe declines in employment. This patterns could be driven by lockdown measures, which were consistently more restrictive for the services sector.
In the services sector, firms with fewer than 100 employees have been the most severely affected by employment losses during the pandemic. Furthermore, because women are disproportionately represented in these firms, they were more greatly affected. The losses were relatively more proportionate in the goods sector, showing different patterns by gender. In both sectors and for both genders, the share of changes in employment among large firms during the pandemic was lower than their pre-COVID-19 share of employment.
Hence, the gaps in employment losses by gender seem to be explained mainly by the high proportion of women working in service industries and by the gaps among small-sized firms in that sector.
One possible explanation for the stark differences in employment losses by gender that was not explored in this study is family responsibilities, especially in the context of the forced daycare and school closures in several provinces during the pandemic. For example, using data similar to those used in this study, Qian and Fuller (2020) show that, from February to May 2020, the pandemic exacerbated the gender employment gap among parents of school-aged children. Family responsibilities may have caused women to stay at home and possibly limited their ability to telework, particularly in the early days of the pandemic. Nevertheless, because service industries are more conducive to telework (Deng, Morissette and Messacar 2020), the employment gap by gender in that sector had almost disappeared by November 2020.
More data and analysis related to telework capacity are needed to fully assess differences in employment losses by gender in occupations in industries and industrial sectors, especially in the goods sector. An element for future study could be whether heterogeneity in terms of telework capacity within industries and across occupations contributes to differences in the patterns observed by gender and across provinces.
Another possible explanation for the differences in employment losses by gender is government support programs such as the Canadian Emergency Recovery Benefit (CERB), which may have altered work decisions for individuals, especially women, at the bottom of the wage distribution. While these policies have maintained the welfare of Canadian families, they have contributed to stalling employment recovery. Further analysis is therefore required to determine the long-term impact of these policies on employment.
Appendix
| Months | Share of women in total employment losses % (March 2020 to February 2021) | Share of women in employment pre-COVID-19 % (March 2019 to February 2020) | Share of women in employment during COVID-19 % (March 2020 to February 2021) |
|---|---|---|---|
| percent | |||
| March | 62.5 | 47.5 | 46.8 |
| April | 50.6 | 47.5 | 47.0 |
| May | 52.9 | 47.3 | 46.4 |
| June | 56.1 | 47.2 | 46.4 |
| July | 50.8 | 46.6 | 46.3 |
| August | 49.6 | 46.6 | 46.4 |
| September | 52.4 | 47.2 | 47.0 |
| October | 52.8 | 47.3 | 47.2 |
| November | 59.6 | 47.5 | 47.2 |
| December | 54.5 | 47.7 | 47.5 |
| January | 57.4 | 47.8 | 47.4 |
| February | 57.6 | 47.8 | 47.4 |
| Weighted average | 53.7 | 47.3 | 46.9 |
|
Note: See Section 2 for the definition of employment. Sources: Statistics Canada, Labour Force Survey and authors’ calculations. |
|||
| March | April | May | June | July | August | September | October | November | December | January | February | Weighted average | |
|---|---|---|---|---|---|---|---|---|---|---|---|---|---|
| percent | |||||||||||||
| Share of employment in base year, % (pre-COVID-19: March 2019 to February 2020) | |||||||||||||
| Firm size | |||||||||||||
| Small firms, men | 40.4 | 40.8 | 41.9 | 41.3 | 41.9 | 42.3 | 42.5 | 42.3 | 42.2 | 42.9 | 42.1 | 41.0 | 41.8 |
| Small firms, women | 9.7 | 10.3 | 10.1 | 10.2 | 9.9 | 10.3 | 10.2 | 10.3 | 10.1 | 10.5 | 10.6 | 11.0 | 10.3 |
| Medium firms, men | 12.0 | 11.5 | 11.2 | 11.4 | 11.4 | 11.2 | 10.9 | 11.0 | 11.4 | 11.1 | 10.8 | 11.1 | 11.3 |
| Medium firms, women | 3.5 | 3.7 | 3.8 | 3.6 | 3.6 | 3.5 | 3.1 | 3.2 | 3.5 | 3.3 | 3.8 | 3.8 | 3.5 |
| Large firms, men | 26.5 | 26.0 | 25.4 | 25.7 | 25.3 | 25.2 | 25.3 | 25.5 | 24.9 | 24.5 | 24.5 | 25.1 | 25.3 |
| Large firms, women | 7.7 | 7.8 | 7.7 | 7.9 | 7.9 | 7.7 | 7.9 | 7.8 | 7.9 | 7.8 | 8.2 | 7.9 | 7.8 |
| Overall | 100.0 | 100.0 | 100.0 | 100.0 | 100.0 | 100.0 | 100.0 | 100.0 | 100.0 | 100.0 | 100.0 | 100.0 | 100.0 |
| Year-over-year changes, % (March 2020 to February 2021) | |||||||||||||
| Firm size | |||||||||||||
| Small firms, men | 0.6 | -17.8 | -13.8 | -7.4 | -7.4 | -9.0 | -6.1 | -6.2 | -4.4 | -5.8 | -5.1 | -3.5 | -7.2 |
| Small firms, women | 2.2 | -16.2 | -8.0 | -4.4 | 2.2 | -0.1 | -2.3 | 0.6 | 5.4 | 2.1 | 0.0 | -7.9 | -2.2 |
| Medium firms, men | -10.6 | -22.1 | -9.4 | -4.3 | -4.3 | 0.4 | 0.3 | 2.5 | 3.2 | 3.8 | 8.5 | 4.9 | -2.4 |
| Medium firms, women | 14.1 | -19.7 | -20.4 | -8.2 | -14.1 | -7.5 | 12.9 | 16.4 | -5.0 | 3.9 | -0.1 | -3.9 | -3.2 |
| Large firms, men | -5.2 | -17.2 | -14.6 | -9.0 | -6.4 | -6.2 | -3.9 | -2.4 | -0.1 | 0.3 | -1.7 | -1.5 | -5.8 |
| Large firms, women | -0.1 | -7.4 | -11.9 | -12.6 | -8.2 | -0.8 | -8.2 | -10.8 | -7.5 | -1.6 | -2.8 | 2.2 | -5.9 |
| Overall | -1.7 | -17.2 | -13.0 | -7.6 | -6.1 | -5.7 | -4.0 | -3.2 | -1.7 | -1.8 | -1.9 | -2.1 | -5.5 |
| Share of total change, % | |||||||||||||
| Firm size | |||||||||||||
| Small firms, men | 6.3 | 42.1 | 44.3 | 40.2 | 47.0 | 66.2 | 52.7 | 53.3 | 52.2 | 72.1 | 57.8 | 40.7 | 46.8 |
| Small firms, women | 6.1 | 9.7 | 6.2 | 5.9 | 3.3 | 0.3 | 4.8 | 1.2 | 15.4 | 6.2 | 0.0 | 24.5 | 6.7 |
| Medium firms, men | 35.5 | 14.7 | 8.1 | 6.5 | 7.4 | 0.8 | 0.6 | 5.5 | 10.4 | 12.2 | 24.9 | 15.2 | 10.7 |
| Medium firms, women | 13.8 | 4.2 | 6.0 | 3.8 | 7.8 | 4.6 | 8.2 | 10.6 | 4.9 | 3.8 | 0.1 | 4.2 | 5.7 |
| Large firms, men | 38.0 | 26.0 | 28.4 | 30.5 | 24.7 | 27.1 | 20.3 | 12.2 | 0.6 | 2.0 | 11.0 | 10.4 | 22.5 |
| Large firms, women | 0.3 | 3.3 | 7.0 | 13.1 | 9.8 | 1.1 | 13.4 | 17.1 | 16.5 | 3.6 | 6.1 | 5.0 | 7.5 |
| Overall | 100.0 | 100.0 | 100.0 | 100.0 | 100.0 | 100.0 | 100.0 | 100.0 | 100.0 | 100.0 | 100.0 | 100.0 | 100.0 |
|
Notes: See Section 2 for the definition of employment. The year-over-year ratio compares each month from March 2020 to February 2021 with the same month in the previous year (March 2019 to February 2020). The index equals 100 if employment in a post-COVID-19 month (e.g., March 2020) equals employment in its pre-COVID-19 counterpart (e.g., March 2019). Sources: Statistics Canada, Labour Force Survey and authors’ calculations. |
|||||||||||||
References
Conference Board of Canada. 2020a. “Sharp, deep, and unprecedented – The Conference Board of Canada releases its Provincial Economic Outlook.” Available at: https//www.conferenceboard.ca/press/newsrelease/2020/04/15/sharp-deep-and-unprecedented-the-conference-board-of-canada-releases-its-provincial-economic-outlook.
Conference Board of Canada. 2020b. “Every major city is affected, some more than others in latest forecast: Pandemic reshapes economic pictures for Canadian cities.” Available at: https//www.conferenceboard.ca/press/newsrelease/2020/05/12/every-major-city-is-affected-some-more-than-others-in-latest-forecast.
Deng, Z., R. Morissette, and D. Messacar. 2020. “Running the economy remotely: Potential for working from home during and after COVID-19.” STATCAN COVID-19: Data to Insights for a Better Canada. Statistics Canada Catalogue no. 45-28-0001. Ottawa: Statistics Canada.
Dey, M., H. Frazis, M.A. Loewenstein, and H. Sun. 2020. Ability to Work from Home: Evidence from Two Surveys and Implications for the Labor Market in the COVID-19 Pandemic.” Monthly Labor Review, June 2020. Available at: https//www.bls.gov/opub/mlr/2020/article/ability-to-work-from-home.htm. Washington: U.S. Bureau of Labor Statistics.
Grekou, D., and H. Liu. 2018. The Entry into and Exit out of Self-employment and Business Ownership in Canada. Analytical Studies Branch Research Paper Series, no. 407. Statistics Canada Catalogue no. 11F0019M. Ottawa: Statistics Canada.
Grekou, D. 2021. How Did the COVID-19 Pandemic Affect the Hours Worked in Canada? An Analysis by Industry, Province and Firm Size. Economic and Social Reports, vol. 1, no. 1. Statistics Canada Catalogue no. 36-28-0001. Ottawa: Statistics Canada.
Hai-Anh H.D., and C.V. Nguyen. 2020. Gender Inequality During the COVID-19 Pandemic: Income, Expenditure, Savings, and Job Loss. IZA Discussion Paper, no. 13824. Bonn: IZA Institute of Labor Economics.
Qian, Y., and S. Fuller. 2020. “COVID-19 and the Gender Employment Gap Among Parents of Young Children?” Canadian Public Policy. August 2020. Available at: https://utpjournals.press/doi/pdf/10.3138/cpp.2020-077.Statistics Canada. 2020. “Labour Survey, October 2020.” The Daily. November 6. Statistics Canada Catalogue no. 11-001-X. Available at: https://www150.statcan.gc.ca/n1/daily-quotidien/201106/dq201106a-eng.htm.
- Date modified: