
Canada at a Glance 2020
Housing

Archived Content
Information identified as archived is provided for reference, research or recordkeeping purposes. It is not subject to the Government of Canada Web Standards and has not been altered or updated since it was archived. Please "contact us" to request a format other than those available.
| Total | Residential | Non-residential | |
|---|---|---|---|
| millions of dollars | |||
| Canada | 102,864 | 62,113 | 40,751 |
| Newfoundland and Labrador | 555 | 239 | 316 |
| Prince Edward Island | 474 | 321 | 153 |
| Nova Scotia | 1,761 | 1,260 | 501 |
| New Brunswick | 1,165 | 571 | 594 |
| Quebec | 21,399 | 11,746 | 9,652 |
| Ontario | 41,338 | 25,537 | 15,801 |
| Manitoba | 3,554 | 1,742 | 1,812 |
| Saskatchewan | 1,588 | 669 | 919 |
| Alberta | 11,647 | 6,999 | 4,648 |
| British Columbia | 19,029 | 12,908 | 6,121 |
| Yukon | 162 | 58 | 104 |
| Northwest Territories | 41 | 20 | 22 |
| Nunavut | 150 | 42 | 108 |
| Source: Statistics Canada, table 34-10-0066-01. | |||
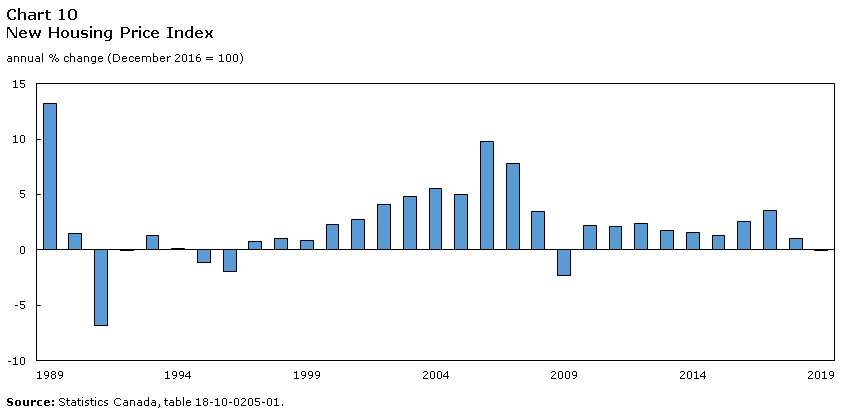
Data table for Chart 10
| Annual percent change | |
|---|---|
| 1989 | 13.2 |
| 1990 | 1.5 |
| 1991 | -6.8 |
| 1992 | 0.0 |
| 1993 | 1.3 |
| 1994 | 0.1 |
| 1995 | -1.2 |
| 1996 | -2.0 |
| 1997 | 0.8 |
| 1998 | 1.0 |
| 1999 | 0.9 |
| 2000 | 2.3 |
| 2001 | 2.7 |
| 2002 | 4.1 |
| 2003 | 4.8 |
| 2004 | 5.5 |
| 2005 | 5.0 |
| 2006 | 9.8 |
| 2007 | 7.7 |
| 2008 | 3.4 |
| 2009 | -2.3 |
| 2010 | 2.2 |
| 2011 | 2.2 |
| 2012 | 2.4 |
| 2013 | 1.7 |
| 2014 | 1.6 |
| 2015 | 1.3 |
| 2016 | 2.5 |
| 2017 | 3.6 |
| 2018 | 1.0 |
| 2019 | -0.1 |
| Source: Statistics Canada, table 18-10-0205-01. | |
| Total | Owned | Rented | |
|---|---|---|---|
| thousands of households | |||
| Canada | 14,790 | 10,138 | 4,653 |
| Newfoundland and Labrador | 219 | 177 | 42 |
| Prince Edward Island | 62 | 46 | 17 |
| Nova Scotia | 411 | 283 | 128 |
| New Brunswick | 323 | 245 | 79 |
| Quebec | 3,665 | 2,283 | 1,381 |
| Ontario | 5,552 | 3,862 | 1,690 |
| Manitoba | 499 | 352 | 147 |
| Saskatchewan | 442 | 329 | 113 |
| Alberta | 1,613 | 1,195 | 417 |
| British Columbia | 1,964 | 1,346 | 619 |
| Yukon | 16 | 10 | 6 |
| Northwest Territories | 15 | 8 | 7 |
| Nunavut | 10 | 2 | 8 |
| Sources: Statistics Canada, table 46-10-0043-01, and the Northwest Territories Bureau of Statistics. | |||
- Date modified: